
Preventive maintenance (PM) frequency is the interval at which scheduled maintenance tasks are performed on an asset — whether daily, weekly, monthly, or by operating hours. Setting the right PM frequency reduces unplanned breakdowns, extends asset life, and keeps maintenance costs under control. Set it too loose and you risk unexpected failures; set it too tight and you waste labour, parts, and production time on equipment that doesn't need attention yet. According to the Society for Maintenance and Reliability Professionals (SMRP), best-in-class facilities target a planned-to-unplanned maintenance ratio of at least 4:1 — meaning 80% of maintenance work is scheduled, not reactive. Getting PM frequency right is the single most direct lever for achieving that target.
Key Takeaways

PM frequency defines how often a piece of equipment receives scheduled inspection, servicing, or part replacement. It is the core variable in any preventive maintenance program — get it right and your equipment runs reliably at the lowest possible cost. Get it wrong in either direction and you pay the price.
When frequency is too low, failure events rise. When frequency is too high, you are effectively penalising yourself with labour and downtime costs that return zero reliability benefit. The goal is the sweet spot: maintain often enough to prevent failures, but not so often that you generate unnecessary work orders, consume spare parts prematurely, or introduce failure modes through the maintenance act itself.
Most maintenance teams set PM frequency once — during the initial setup — and never revisit it. That is where the problem starts. Operating conditions change, asset age increases, and production demands shift. A PM frequency that was correct at commissioning may be either excessive or insufficient three years later. Frequency calibration is not a one-time task; it is an ongoing maintenance discipline.
Over-maintenance is often invisible because it looks like diligence. The PM completion rate is high. The schedule is full. The team is busy. But the costs are real and they compound across every asset you are maintaining too often.
The bottom line: over-maintenance is not free. It is a cost masquerading as caution.

Setting the correct PM frequency requires four inputs. Using all four together produces a defensible, data-backed interval. Using only one or two produces a guess with a schedule attached to it.
Start here — but treat manufacturer guidance as a conservative baseline, not the final answer. Manufacturers set their recommended service intervals under controlled test conditions that rarely match your specific operating environment. A compressor manufacturer recommends oil changes every 2,000 operating hours in a clean, temperature-controlled environment. Your compressor runs in a dusty foundry at 90% load. Your real-world interval should be shorter.
Conversely, if your asset runs in a light-duty, low-temperature environment, you may safely extend beyond the manufacturer's recommendation — once your failure history supports it. Always start conservative and extend with evidence, never the reverse.
Criticality scoring is the most important input to frequency calibration. An asset's criticality is determined by two factors: the likelihood of failure and the consequence of failure. A critical production asset — one whose failure halts the line, creates a safety hazard, or cannot be bypassed — deserves more frequent attention than a non-critical backup that can be taken offline without impact.
Before setting any PM frequency, score each asset on a simple 1–5 criticality scale. High-criticality assets (scores 4–5) warrant more conservative intervals and more thorough task lists. Low-criticality assets (scores 1–2) are candidates for extended intervals and simplified checklists. Applying the same frequency to every asset regardless of criticality is one of the most common PM programme mistakes.
Mean Time Between Failures (MTBF) is the most direct data input for PM frequency calibration. If an asset fails every 800 operating hours on average without preventive maintenance, you should be servicing it well before that point — typically at 60–70% of MTBF to provide a meaningful safety buffer. If MTBF is 2,000 hours and you are servicing every 200 hours, you have strong evidence that your interval is set too aggressively.
Use the MTBF calculator to establish your current failure frequency baselines per asset. Then compare your existing PM intervals against those baselines. The gaps — where PM frequency is either far below or far above 60–70% of MTBF — are your immediate optimisation opportunities.
If you do not yet have failure history data because you are setting up a new programme, use manufacturer data and industry benchmarks as a proxy for the first 6–12 months, then recalibrate once your own CMMS data accumulates.
The same asset model in two different operating environments will have different optimal PM frequencies. Key environmental and usage factors that drive frequency up include: high ambient temperature, dusty or corrosive atmospheres, continuous duty cycles (24/7 operation vs 8-hour shifts), high mechanical load or vibration, exposure to moisture or chemicals, and infrequent lubrication access. Each of these accelerates degradation rates and should compress your PM intervals relative to the manufacturer's baseline.
Operating conditions that allow extended intervals include light-duty cycles, clean climate-controlled environments, modern sealed-bearing designs that require no greasing, and redundant systems where failure of one unit does not affect production output.
PM tasks should not all be triggered the same way. Different asset types and failure modes call for different trigger mechanisms — and the right trigger type directly affects how efficiently you are spending your maintenance resources.
Most PM programmes use a mix of all four. The key is matching each task to the trigger type that best reflects how that specific failure mode actually develops.
| PM Frequency Setting | Failure Risk | Labour Cost | Parts Consumption | Induced Failure Risk |
|---|---|---|---|---|
| Too low (under-maintained) | High — failures likely before next PM | Low planned, high reactive | Low planned, high emergency | Low |
| Calibrated (evidence-based) | Low — PM intercepts degradation | Optimal | Optimal | Low |
| Too high (over-maintained) | Low failure, but induced risk rises | High — unnecessary tasks | High — premature replacement | High |
The calibrated zone between under- and over-maintenance is where your programme should operate. Both extremes cost more than a well-tuned middle ground, but the over-maintenance cost is often underestimated because it hides inside a busy-looking maintenance schedule.
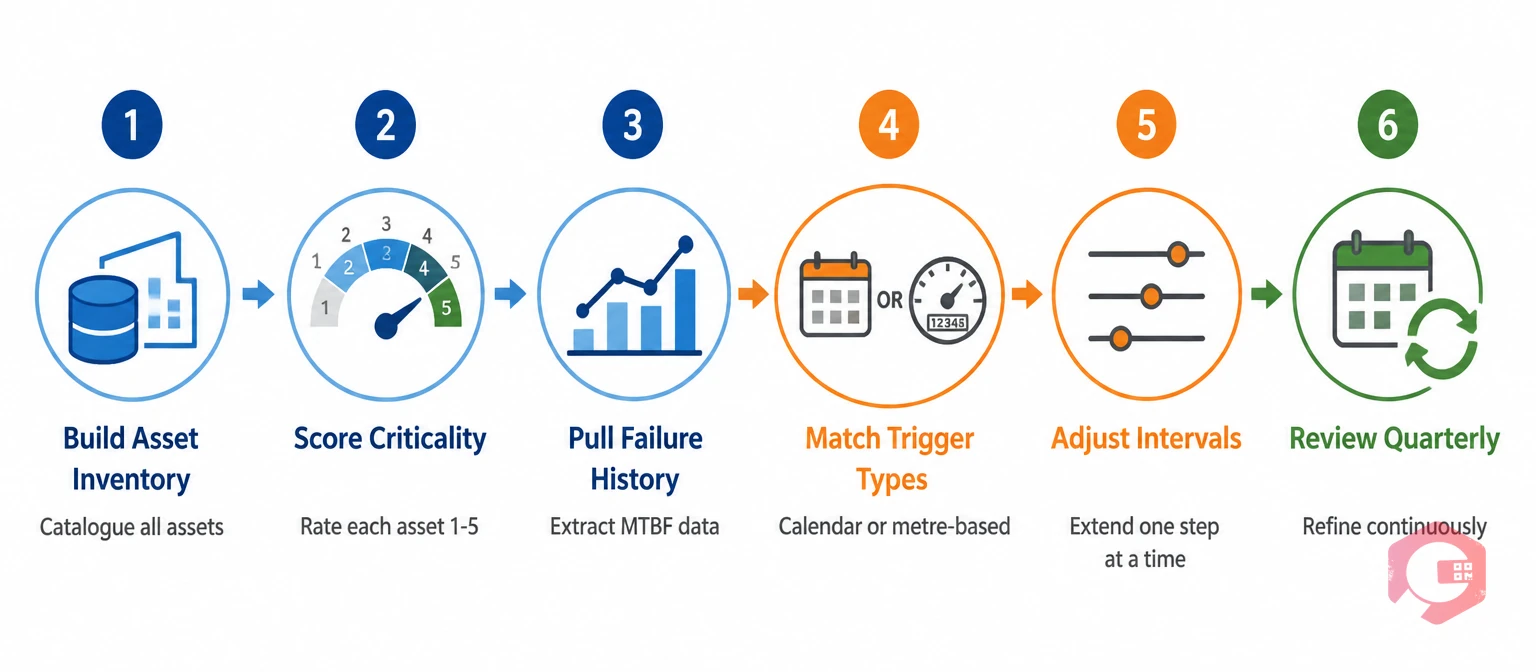
Follow this sequence to move from a default or guessed PM schedule to one grounded in evidence.
Your data will tell you when PM frequency needs adjustment — if you know what to look for. These are the key signals in both directions.
Signs you are under-maintaining (frequency too low): repeated failures on the same asset occurring between PM intervals; MTBF trending downward over consecutive quarters; reactive work orders on an asset consistently spiking after PM due dates are passed; technicians frequently finding significant wear or contamination at PM time — suggesting the service is arriving late relative to the degradation curve.
Signs you are over-maintaining (frequency too high): PM tasks consistently finding equipment in near-perfect condition with minimal wear, contamination, or parameter deviation; MTBF is high and stable but PM compliance rate is also high — suggesting you are maintaining an asset that does not need it; maintenance-induced faults on assets that only fail shortly after a PM visit; technician time consumed by low-value PM tasks on non-critical assets while higher-priority work waits.
A well-configured maintenance checklist platform captures the condition data at each PM visit that makes these signals visible. When technicians record findings — wear measurements, fluid condition, vibration readings — against a structured checklist at every visit, you accumulate the evidence base needed to make calibration decisions with confidence rather than guesswork.
Managing PM frequency calibration across a large asset fleet by hand — in spreadsheets or shared drives — is feasible for a handful of assets. For any operation with 50 or more assets, it becomes unmanageable without software support. A CMMS transforms frequency calibration from a periodic manual exercise into an ongoing automated process.
Cryotos's preventive maintenance software supports multiple trigger types on a single asset simultaneously — calendar, metre-based, and condition-based triggers can all be active at once, with whichever fires first generating the work order. This first-to-trigger logic automatically tightens effective frequency in high-demand periods and relaxes it when utilisation drops — without requiring any manual schedule adjustment.
The reporting layer is where frequency optimisation becomes data-driven at scale. Cryotos tracks MTBF per asset automatically from work order close data, flags assets where PM intervals significantly diverge from observed failure patterns, and surfaces planned-to-unplanned ratios across the fleet. Maintenance managers get a clear picture of which assets are driving unnecessary PM labour and which may be under-protected — without needing to manually analyse work order logs. According to Plant Maintenance Resource Center, facilities that use CMMS-driven PM interval analysis reduce total maintenance labour costs by 15–25% within 18 months of implementation, primarily by eliminating unnecessary PM tasks on non-critical, well-performing assets.
The planned downtime impact is equally significant. When PM frequency is correctly calibrated, the aggregate planned downtime across your asset fleet shrinks — because you are only taking assets offline for maintenance when the evidence supports it, not because a calendar date was reached.
There is no single universal answer — optimal PM frequency depends on asset criticality, manufacturer recommendations, operating conditions, and observed failure patterns. As a starting framework: high-criticality assets operating in harsh environments typically need monthly or more frequent attention; medium-criticality assets in normal conditions suit quarterly intervals; low-criticality assets with low failure impact can often be maintained semi-annually or annually. Always start from manufacturer guidance and refine with your own MTBF data over time.
Time-based PM fires at fixed calendar intervals regardless of how much the asset has actually run. Usage-based PM fires when a metre reading — operating hours, cycles, kilometres — reaches a defined threshold. Usage-based is more accurate for equipment where wear correlates with use rather than the passage of time, and it avoids maintaining underutilised assets on the same aggressive schedule as heavily used ones.
Over-maintenance means performing PM tasks more frequently than the asset's failure patterns or condition warrants. It manifests as technicians consistently finding near-perfect equipment during PM visits, high PM labour costs relative to the reactive work prevented, and maintenance-induced failures on assets disturbed unnecessarily. The fix is to extend intervals incrementally using MTBF data and monitor for any change in failure rates.
A CMMS does not typically auto-adjust intervals without human review, but it provides the data that makes calibration decisions clear. Cryotos tracks MTBF per asset, flags divergence between PM intervals and observed failure patterns, and reports planned-to-unplanned ratios — giving maintenance managers clear signals about which intervals need adjustment and in which direction. The final decision remains with the maintenance team, but it is informed by live data rather than guesswork.
The difference between a PM programme that drives down costs and one that silently wastes them often comes down to a single variable: frequency calibration. Cryotos gives your team the scheduling flexibility, trigger options, checklist data capture, and MTBF reporting needed to set and maintain the right PM intervals across every asset in your portfolio. Schedule a free demo to see how leading maintenance teams use Cryotos to eliminate both under-maintenance and over-maintenance from their operations.


Cryotos AI predicts failures, automates work orders, and simplifies maintenance—before problems slow you down.


