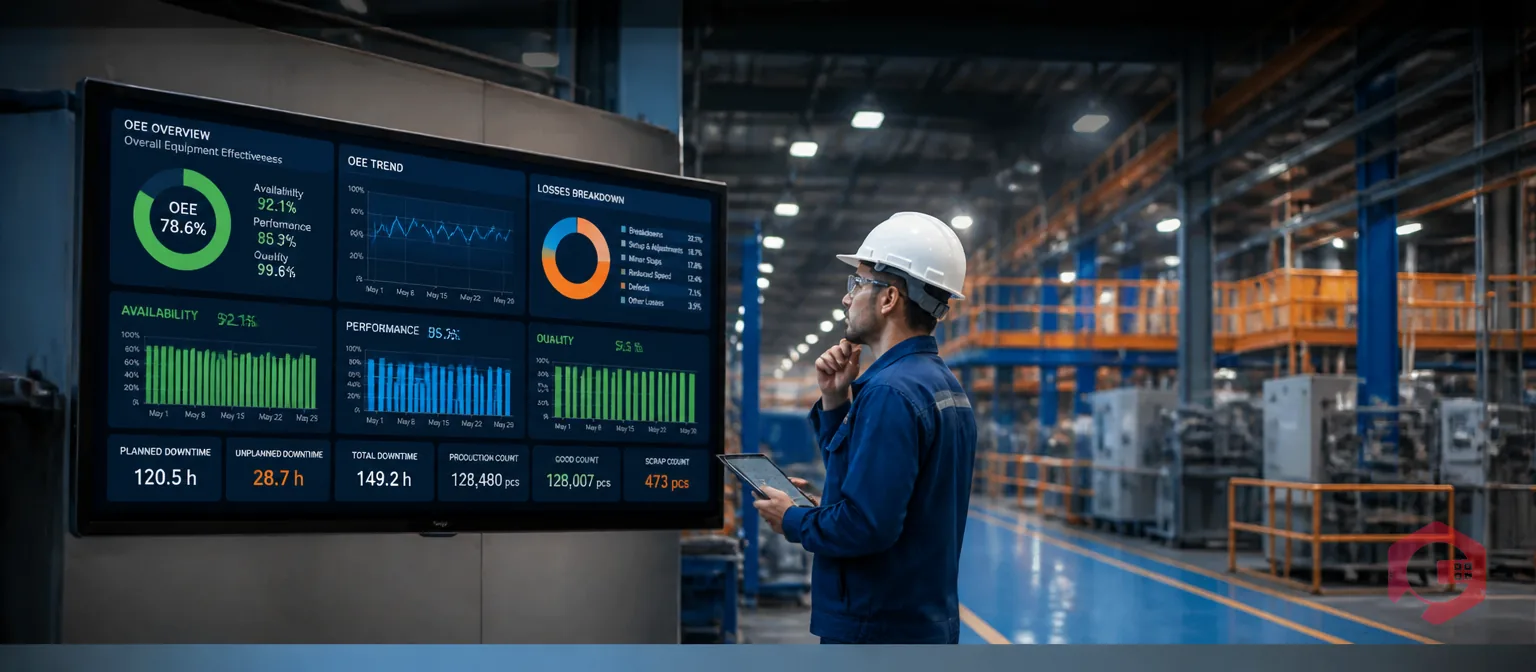
Total Productive Maintenance (TPM) programs are often evaluated by a single number: Overall Equipment Effectiveness (OEE). OEE measures availability, performance, and quality in a single composite score, and for many plant managers it has become the default answer to "how is our TPM program doing?" The problem is that OEE is a lagging indicator — it tells you what already happened, not why it happened or what will happen next.
A TPM program that improves OEE from 55% to 68% over 18 months has achieved something real. But if you cannot explain which maintenance practices drove that improvement, you cannot repeat it, sustain it, or identify where the next 10 points will come from. Measuring TPM success requires a portfolio of metrics that spans equipment reliability, team behaviour, cost efficiency, and maintenance maturity — not just the output number that OEE provides. A Computerized Maintenance Management System makes this possible by capturing the granular activity data that populates each metric automatically.
Key Takeaways

OEE was designed by Seiichi Nakajima as part of the original TPM framework to give production managers a single, comparable measure of how effectively equipment turns scheduled time into good output. As overall equipment effectiveness is calculated — Availability × Performance × Quality — it compresses three distinct failure modes into one number. That compression is both its strength and its limitation.
OEE tells you that something went wrong; it does not tell you what to fix. A plant with 70% OEE could be suffering from chronic unplanned breakdowns, from chronic slow running due to inadequate lubrication, from chronic quality defects due to tooling wear, or from some combination of all three. Each of these requires a completely different maintenance response. Without the supporting metrics, OEE points to the symptom without revealing the cause.
TPM is a program, not a metric — and programs must be measured at the activity level, not just the output level. The right set of maintenance metrics covers equipment reliability, team behaviour, cost efficiency, and cultural change — dimensions that OEE alone cannot capture. According to the SMRP Best Practices framework for maintenance and reliability, world-class maintenance organisations track a balanced scorecard of 8 to 12 metrics across equipment reliability, workforce efficiency, and maintenance cost. OEE appears in that scorecard as one of several output measures — not as the sole indicator of program health.
The practical consequence: maintenance managers who rely on OEE alone consistently identify problems too late, cannot attribute improvement to specific actions, and struggle to build the business case for continued TPM investment. The solution is not to abandon OEE but to surround it with the leading indicators and process metrics that explain it.
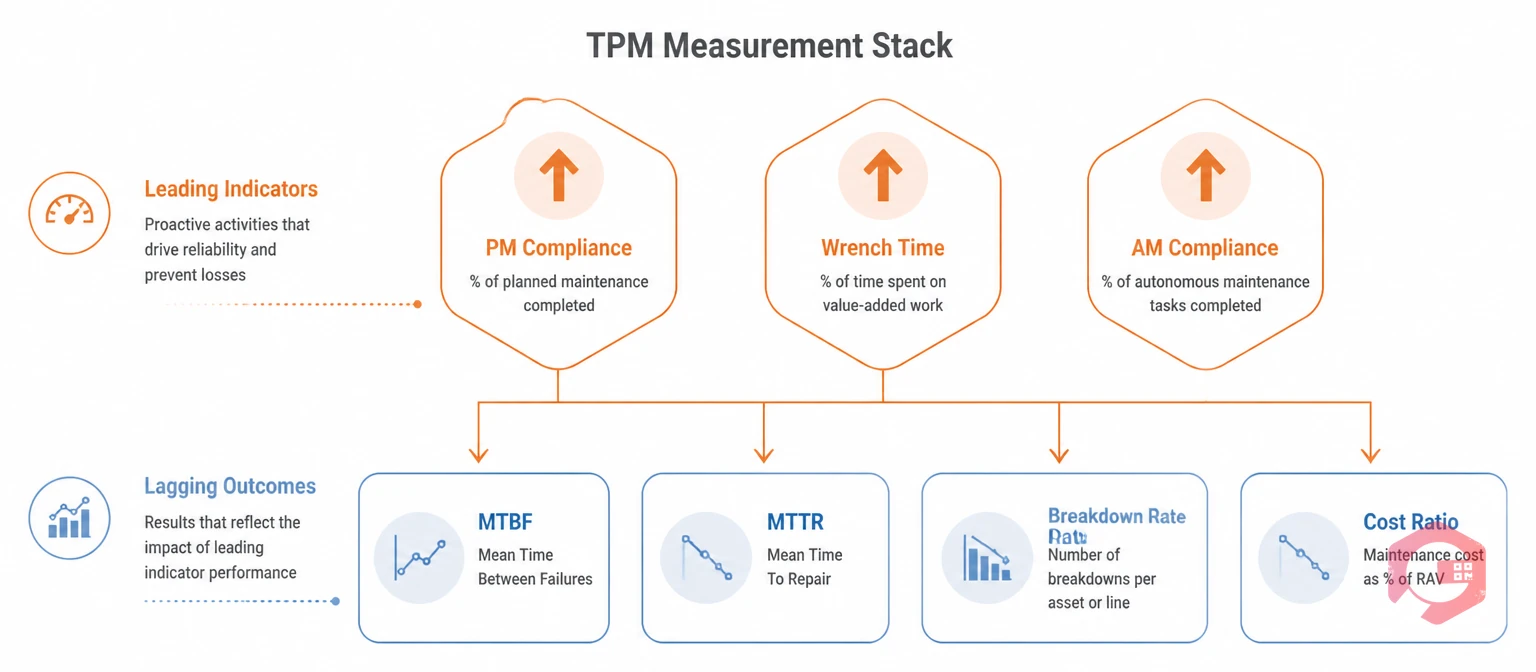
Effective TPM measurement uses two types of metrics: lagging indicators that measure outcomes and leading indicators that measure the activities and behaviours that produce those outcomes. OEE is a lagging indicator. PM compliance rate is a leading indicator. The distinction matters because leading indicators give you time to intervene — a declining PM compliance rate predicts rising breakdown frequency 30 to 90 days before it appears in your MTBF or OEE figures.
The TPM Measurement Stack organises the seven core metrics into two tiers:
| Metric | Type | What It Measures | TPM Pillar |
|---|---|---|---|
| MTBF | Lagging | Equipment reliability between failures | Planned Maintenance |
| MTTR | Lagging | Maintenance team repair speed | Planned Maintenance |
| Planned Maintenance % (PMP) | Leading | Ratio of planned to total maintenance work | Planned Maintenance |
| Wrench Time | Leading | % of shift time spent on actual maintenance tasks | Planned Maintenance / Education |
| AM Compliance Rate | Leading | Operator adherence to daily care routines | Autonomous Maintenance |
| Breakdown Rate | Lagging | Unplanned failure frequency per asset | Focused Improvement |
| Maintenance Cost % of RAV | Lagging | Maintenance spend relative to asset replacement value | All Pillars |
The leading indicators in this stack — PMP, wrench time, and AM compliance rate — are the metrics that TPM managers should review weekly. The lagging indicators — MTBF, MTTR, breakdown rate, and cost ratio — are reviewed monthly or quarterly to confirm that the program's activities are producing the expected reliability and cost outcomes.
Mean Time Between Failures is the average operating time between one unplanned failure and the next for a given asset. It is the most direct measure of equipment reliability and the metric most sensitive to the quality of your planned maintenance program. An improving MTBF trend — assets failing less frequently as the TPM program matures — is the clearest signal that your maintenance interventions are working.
MTBF is calculated as total operating time divided by the number of failures in the measurement period. For a motor that ran for 2,400 hours and experienced three failures: MTBF = 2,400 ÷ 3 = 800 hours. Use the MTBF calculator to calculate this figure per asset and track trend direction over time.
MTBF benchmarks: SMRP data shows world-class plants improve MTBF by 25 to 40% within the first two years of a structured TPM program. Any MTBF trending upward quarter-over-quarter means your maintenance metrics are moving in the right direction. A flat or declining MTBF means planned maintenance is either under-executed or misaligned with the actual failure modes the asset experiences.
Track MTBF at the asset level, not just plant-wide averages. A plant-wide MTBF figure can mask two or three chronic problem assets that are dragging down the average while the rest of the fleet is perfectly stable. Asset-level MTBF data in your CMMS identifies these outliers for focused improvement action.
Mean Time to Repair measures the average time from failure detection to full operational restoration — capturing diagnosis time, parts sourcing, repair execution, and testing before return to service. While MTBF tells you how often equipment fails, MTTR tells you how effectively your maintenance team responds when it does.
MTTR is calculated as total downtime hours divided by the number of repair events in the period. A motor that experienced three failures with downtime of 2, 5, and 3 hours gives MTTR = 10 ÷ 3 = 3.3 hours. Use the MTTR calculator to track this by asset, by failure type, and by maintenance crew.
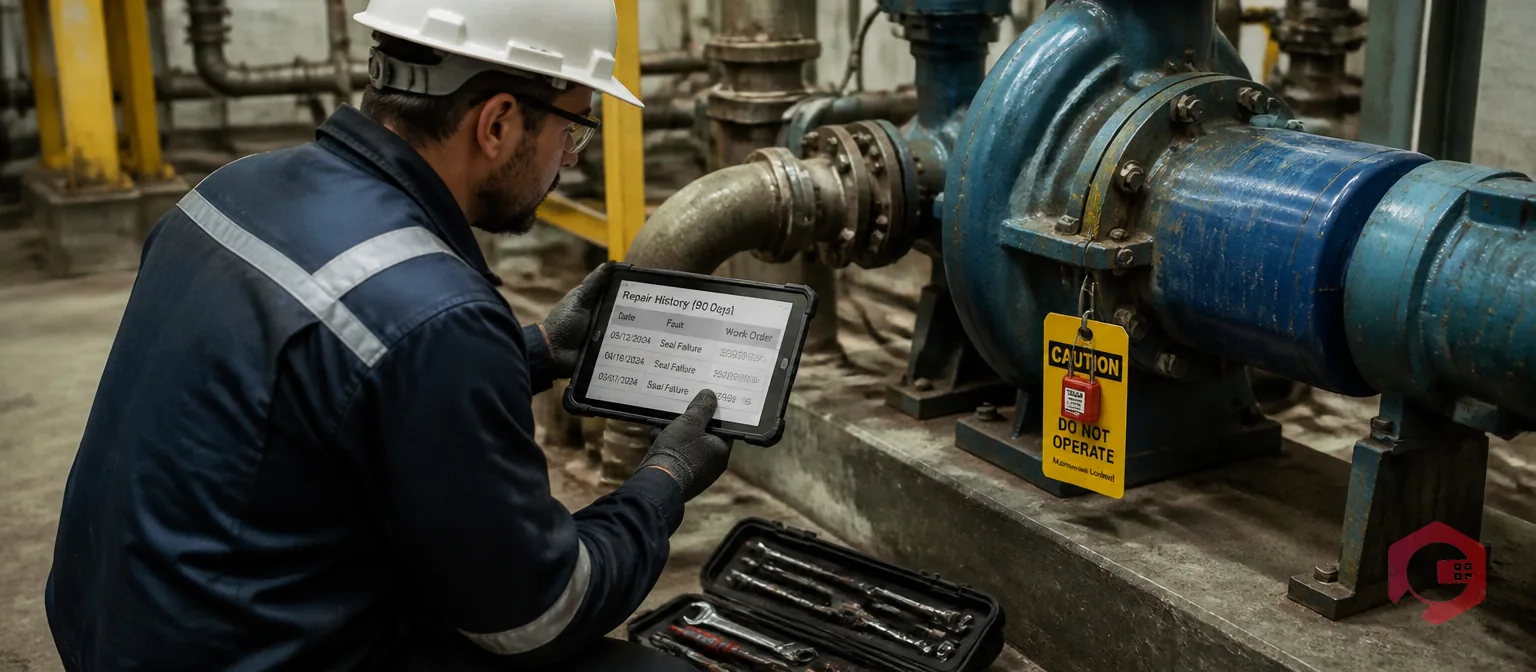
High MTTR — relative to the asset's criticality and the repair's complexity — typically points to one of three root causes: parts are not available when needed, the diagnosis process is inefficient, or technicians lack specific skills for that asset type. Each diagnosis requires a different corrective action. A CMMS that links repair time data to parts availability records and technician assignment history makes the root cause visible rather than leaving it to guesswork.
Maintenance teams using Cryotos have reported up to 25% faster repair turnaround — an MTTR improvement directly attributable to mobile access to repair history, parts availability visibility, and structured work order workflows that eliminate the diagnosis lag.
Planned Maintenance Percentage measures the proportion of total maintenance hours devoted to planned work — preventive maintenance, predictive inspections, and scheduled overhauls — versus reactive work responding to unplanned failures. It is the single most predictive leading indicator in the TPM measurement stack.
PMP is calculated as planned maintenance hours divided by total maintenance hours, expressed as a percentage. If a maintenance team works 480 hours in a month and 320 of those hours are on planned work: PMP = 320 ÷ 480 = 67%.
World-class maintenance operations, as defined by SMRP benchmarking, achieve PMP of 85% or higher. Most plants starting a TPM program sit between 40% and 60% — spending the majority of their maintenance capacity responding to breakdowns rather than preventing them. The shift from 60% to 85% PMP is typically the single largest driver of MTBF improvement over a TPM program's first two years. Use the PMP calculator to establish your baseline and set quarterly improvement targets.
Cryotos tracks PMP automatically from work order data — distinguishing planned PM work orders from corrective and emergency work orders and calculating the ratio across any time period, asset group, or maintenance team. This eliminates the manual data collection that makes PMP impractical to monitor in paper-based systems.

Wrench time measures the percentage of a maintenance technician's shift that is spent on direct, value-adding maintenance activity — turning wrenches, completing inspections, executing PM tasks — versus non-value-adding activity like waiting for parts, travelling to jobs, searching for information, or attending unnecessary meetings.
Industry research consistently finds that technicians in reactive, disorganised maintenance environments spend only 25 to 35% of their available time on actual maintenance work. World-class operations achieve 50 to 60% wrench time. The difference between 30% and 55% wrench time on a team of ten technicians is equivalent to gaining between two and three additional full-time technicians without adding headcount.
Improving wrench time requires addressing the systemic causes of non-productive time: parts not staged before the job starts, work orders arriving without enough technical detail, unclear job priorities creating decision paralysis at the start of each shift, and excessive walk time to assets that could be batched geographically. The wrench time calculator helps quantify the opportunity and track progress as scheduling and parts processes improve.
Autonomous Maintenance Compliance Rate measures the percentage of operator-led daily care routines — cleaning, lubrication, inspection, and basic adjustments — that are completed on schedule across the production floor. This metric directly tracks the health of TPM's Jishu Hozen pillar and is the leading indicator most sensitive to the gap between TPM paperwork and TPM practice.
AM compliance rate is the metric that distinguishes a TPM program that exists on paper from one that is functioning in practice. A plant can have perfectly documented autonomous maintenance standards and a schedule showing 100% assignment — and still have operators skipping 40% of their daily routines because there is no system to verify completion or consequence for non-compliance.
Digital AM checklists in a CMMS make compliance measurement automatic: when an operator completes a daily care checklist on their mobile device, the system records it with a timestamp. Uncompleted tasks remain flagged until they are either done or formally deferred with a reason. The compliance rate is calculated and visible in real time without any manual aggregation.
Breakdown Rate tracks the number of unplanned equipment failures per asset per period — typically expressed as breakdowns per machine per month or per thousand operating hours. It is the most operationally immediate lagging indicator in the TPM stack, directly counting the events that disrupt production and drive reactive maintenance spend.
Breakdown rate differs from MTBF in its primary use: MTBF is used for reliability trending and PM interval optimisation. Breakdown rate is used for prioritising focused improvement activity — identifying which specific assets, failure modes, or production areas account for the largest share of unplanned events.
A Pareto analysis of breakdown rate data — ranking assets by failure frequency — almost always reveals that 20% of assets account for 60 to 80% of all unplanned downtime events. These assets are the targets for focused improvement (Kobetsu Kaizen), the TPM pillar specifically designed to eliminate the root causes of chronic, recurring failures.
Tracking breakdown rate effectively requires that every unplanned failure is captured in a structured work order with the asset ID, failure mode, and repair duration. The downtime tracking module in a CMMS automates this data capture and surfaces the Pareto analysis without manual spreadsheet work. Maintenance teams using Cryotos report a 30% reduction in unplanned downtime within 12 months of full deployment — a direct result of the focused improvement activity that accurate breakdown rate data enables.
The Maintenance Cost to Replacement Asset Value ratio expresses annual maintenance spend as a percentage of the total replacement cost of the asset base being maintained. It is the most strategic financial metric in the TPM measurement stack, used to assess whether overall maintenance investment is appropriate, excessive, or insufficient relative to the asset portfolio's value and condition.
Maintenance Cost % RAV = (Annual Maintenance Spend ÷ Total Asset Replacement Value) × 100. A manufacturing facility spending $1.5M per year on maintenance for an asset base with a replacement value of $30M has a maintenance cost ratio of 5%.
TPM programs that are working correctly typically see maintenance cost ratio decline over 2 to 3 years — as the shift from reactive to planned work eliminates emergency cost premiums and as improved reliability extends component life. A rising cost ratio despite an active TPM program is a strong signal that either PMP is lower than reported or that focused improvement activity is not targeting the assets driving the most spend.
The practical barrier to measuring TPM success with all seven metrics is data collection. MTBF requires accurate failure event timestamps. MTTR requires repair start and end times linked to specific assets. PMP requires consistent work order type classification. Wrench time requires time-tracking data at the task level. AM compliance requires checklist completion records. Breakdown rate requires every unplanned event to be logged. Maintenance cost ratio requires work order cost data linked to an asset register with replacement values.
In a paper-based or spreadsheet-driven maintenance environment, collecting and calculating all seven maintenance metrics simultaneously is impractical — which is why most maintenance teams default to tracking OEE alone and hoping it captures enough.
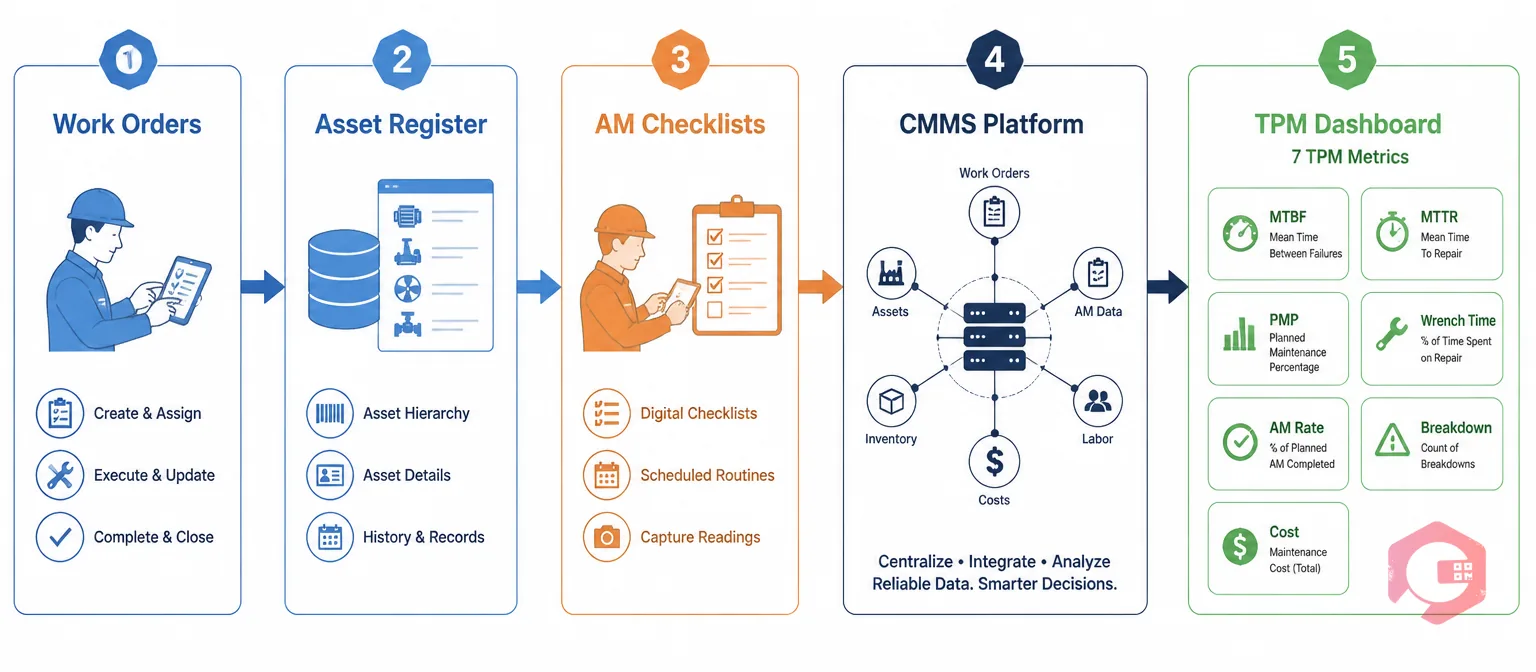
A CMMS transforms this from a data collection problem into a reporting problem. When technicians create and close work orders on a mobile device, all the data needed for MTBF, MTTR, PMP, breakdown rate, and cost ratio is captured automatically as a byproduct of normal work management. When operators complete AM checklists digitally, compliance rate is calculated in real time. When the system knows the replacement value of each asset in the register, maintenance cost ratio is a single query.
The BI Dashboard in Cryotos surfaces all seven TPM metrics — MTBF and MTTR trends by asset, PMP ratio by team and period, breakdown frequency Pareto, and maintenance cost analysis — in a single configurable view. Maintenance managers can review the full TPM measurement stack in one session rather than assembling data from multiple sources before each monthly review meeting.
Planned Maintenance Percentage (PMP) is the most predictive single metric for TPM program health. It is a leading indicator — reflecting whether planned maintenance activity is being executed consistently — and it reliably predicts future MTBF, breakdown rate, and OEE trends. A TPM program with rising PMP is almost certain to show improving reliability metrics within 60 to 90 days. A TPM program with stagnant or declining PMP will not sustain OEE gains regardless of other activities.
Leading indicators — PMP, AM compliance rate, and wrench time — should be reviewed weekly by maintenance and production supervisors because they allow intervention before problems appear in equipment performance. Lagging indicators — MTBF, MTTR, breakdown rate, and maintenance cost ratio — are typically reviewed monthly at team level and quarterly at management level, where they are used to validate that the program's activities are producing the expected reliability and cost trends.
Industry benchmarks typically define 85% OEE as the world-class target for discrete manufacturing environments, a benchmark established in Nakajima's original TPM work. However, the more useful question is not whether OEE is at 85% but whether it is improving consistently and whether the improvement can be attributed to specific TPM activities. A plant at 72% OEE with a clear improvement trajectory and strong leading indicators is in a healthier position than a plant at 80% OEE with declining PMP and rising breakdown rates.
Yes — but only with a CMMS that automates data capture. Manually calculating MTBF, MTTR, PMP, and the other metrics requires assembling data from work orders, time records, asset registers, and cost systems that in paper-based environments live in different formats and locations. A maintenance management platform captures all this data as technicians perform their normal work and generates the metrics automatically. For small plants, the key is starting with two or three metrics — typically PMP, MTBF, and AM compliance rate — and adding the others as the data collection process matures.
Measuring TPM success requires looking beyond OEE to the full portfolio of metrics that explain what your program is doing and where it is heading. Schedule a free demo to see how Cryotos surfaces MTBF, MTTR, PMP, wrench time, AM compliance, and breakdown rate in a single dashboard — so your team always knows exactly where your TPM program stands.


Cryotos AI predicts failures, automates work orders, and simplifies maintenance—before problems slow you down.


