

Maintenance performance metrics are the quantitative indicators — MTTR, MTBF, OEE, BDO, BDH, and asset availability — that tell maintenance managers exactly how well their team is keeping equipment running, how fast they respond to failures, and how much value they deliver to operations. According to a study by Plant Engineering, facilities that track maintenance KPIs with a dedicated CMMS reduce unplanned downtime by up to 30% and cut emergency repair costs by 25% within the first year of structured measurement.
This guide covers the six metrics every maintenance team should track, how Cryotos CMMS calculates and surfaces them automatically, and what actionable decisions each metric drives — from daily work order prioritization to quarterly budget reviews.

A machine sitting idle for an unplanned hour does more damage than the repair cost alone. It triggers a cascade: lost production, overtime labour, expedited parts, missed SLAs, and production schedule chaos that ripples through the next three shifts. The challenge isn’t just fixing equipment faster — it’s understanding failure patterns before they compound into a crisis.
Traditional spreadsheet-based tracking collapses the moment you need to spot trends across fifty assets, correlate failure frequency with PM compliance, or hold teams accountable against defined targets. Maintenance management software like Cryotos is purpose-built to close that gap — calculating KPIs automatically from real work order data, surfacing them on live dashboards, and turning raw maintenance events into decisions that protect uptime.
According to McKinsey Operations Research, companies that adopt data-driven maintenance programs report 10–25% reductions in overall maintenance costs alongside measurable improvements in asset availability. The math is straightforward: what gets measured gets managed, and what gets managed improves.
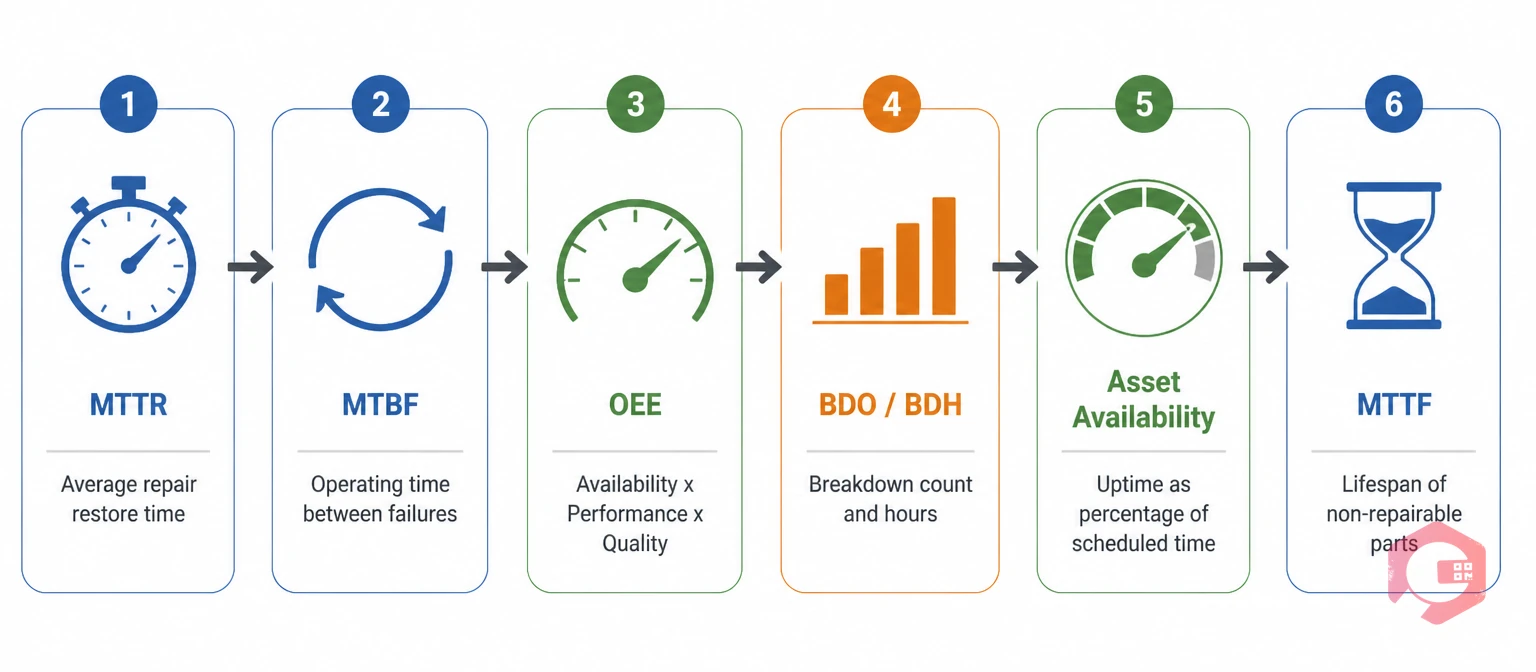
Mean Time to Repair (MTTR) measures the average time your team takes to restore a failed asset to working condition — from the moment a failure is detected to the moment the asset returns to service. It is the sharpest indicator of your team’s responsiveness, skill depth, and how well your spare parts inventory is stocked.
Formula: MTTR = Total Downtime ÷ Number of Repair Events
A declining MTTR signals that your technicians are better prepared, your job plans are more detailed, and your parts are closer to the point of use. An increasing MTTR is often the first sign of parts shortages, technician skill gaps, or work orders being logged after repair rather than at failure detection — a data discipline problem that distorts every metric downstream.
Cryotos calculates MTTR in real time from work order timestamps. The moment a technician closes a work order, the system updates the MTTR figure for that asset, that asset category, and that plant — no manual calculation, no end-of-month reconciliation.
Mean Time Between Failures (MTBF) tracks how reliably an asset runs between consecutive failures. It is the primary indicator of equipment health and the foundation of any preventive maintenance scheduling strategy. A declining MTBF is an early warning signal: the asset is deteriorating, and preventive intervention is overdue.
Formula: MTBF = Total Operating Time ÷ Number of Failures
MTBF is most powerful when trended over time. An asset with an MTBF of 480 hours this quarter, down from 620 hours last quarter and 890 hours the quarter before, is communicating something clear: it needs attention before it fails catastrophically. Cryotos surfaces this trend automatically in the BI Dashboard, so maintenance managers can act before operations notices the degradation.
Overall Equipment Effectiveness (OEE) is the gold-standard metric for manufacturing maintenance programs. It combines three factors — Availability, Performance, and Quality — into a single score that reveals the true productive output of your equipment versus its theoretical maximum.
Formula: OEE = Availability % × Performance % × Quality %
World-class manufacturing targets OEE of 85% or above. Most facilities starting a structured measurement program discover their real OEE sits between 40% and 60% — not because their equipment is unreliable, but because unplanned downtime, speed losses, and quality defects are being absorbed into operations without being measured. Cryotos tracks all three OEE components for top machines, feeding real work order data into the calculation rather than relying on manual operator logs.
Downtime tracking through Breakdown Count (BDO) and Breakdown Hours (BDH) reveals which assets drain the most maintenance resources and carry the highest operational risk. BDO tracks the frequency of unplanned failures; BDH captures the cumulative time those failures consume. Together they answer the question every maintenance manager needs answered before a capital budget meeting: which assets cost the most to keep running, and which ones should be scheduled for replacement rather than repair?
Cryotos logs every breakdown event against the specific asset at the moment the work order is created, with automatic timestamp capture that starts the BDH clock the moment failure is reported. This eliminates the common problem of technicians estimating downtime at shift end — the data is accurate because it’s captured in real time.
Asset availability measures the percentage of scheduled operating time during which an asset is actually available for production. It is a direct input to OEE and the clearest single-number summary of maintenance program effectiveness that operations management understands without needing a maintenance background.
Formula: Availability = Uptime ÷ (Uptime + Downtime) × 100
The difference between 92% and 87% availability on a critical production asset, running 6,000 hours per year, is 300 hours of lost production. For most manufacturing environments, that gap represents hundreds of thousands of dollars in missed throughput. Cryotos tracks availability per asset, per asset category, and per plant — making the business case for preventive maintenance investment concrete and defensible.
Mean Time to Failure (MTTF) applies to non-repairable components and single-use items — bearings, belts, filters, and seals — where the question is not how quickly you can repair them but how long they last before replacement. Paired with the failure rate calculator, MTTF data drives smarter replacement scheduling and more accurate spare parts stocking decisions.
| OEE Score | Performance Level | What It Means | Priority Action |
|---|---|---|---|
| 85%+ | World-class | Equipment running at near-theoretical maximum | Sustain PM programme and benchmark improvements |
| 70–84% | Good performance | Above average with specific loss areas identifiable | Target availability or performance losses for improvement |
| 55–69% | Average plant | Significant hidden losses in speed and quality | Implement structured PM and downtime classification |
| Below 55% | Needs immediate attention | High unplanned downtime and reactive culture | Deploy CMMS, track BDO/BDH, investigate top failures |

Cryotos is not a work order tracker with a reporting module bolted on — it is a full analytical engine designed so that every maintenance event automatically feeds into KPI calculations without any manual data entry from managers. Here is how the core platform capabilities connect to the metrics that matter.
The BI Dashboard gives maintenance managers a live view of MTTR, MTBF, OEE, BDO, BDH, and asset availability — broken down by asset, asset category, plant, and time period — without running a single report manually. Dashboards are configurable: a plant manager’s view shows fleet-level availability and top-failure assets; a technician’s view shows their own work order close rates and MTTR contribution. The same data, scaled to the right audience.
The work order management software is where all metric data originates. Work orders are created via AI voice recognition, QR code scan at the asset, or automatic generation from IoT sensor threshold breaches — and every work order carries a timestamp from the moment of failure detection. This timestamp discipline is what makes Cryotos MTTR calculations accurate: the clock starts when the problem is reported, not when a supervisor gets around to logging it.
The Report Builder generates 50+ standard maintenance reports — including MTTR trend by asset, MTBF comparison across machines, OEE component breakdown, and maintenance cost per asset — with scheduled email delivery to managers, plant directors, and finance teams. When the quarterly budget review arrives, the data is already in your inbox.
One of the most practical advantages of Cryotos is its mobile-first architecture. Technicians log breakdown events, update work order status, complete maintenance checklists, and trigger meter readings directly from iOS or Android devices at the asset location — with full offline capability that syncs automatically when connectivity returns.
This real-time field data flows instantly into the KPI engine. MTTR calculations update the moment a repair is completed, not two days later when someone remembers to update a spreadsheet. BDH accumulates automatically while a work order remains open, then stops the moment it closes. The metrics are only as good as the data behind them — and Cryotos is designed so that the easiest thing for a technician to do is also the most accurate thing for a metric to record.
Maintenance managers receive scheduled email reports daily or weekly with the dashboard views they care about, keeping the entire team aligned on performance without requiring everyone to log into the system daily.
What separates good maintenance programs from great ones is a culture of continuous improvement applied to the data those programs generate. Cryotos includes a built-in 5 Whys root cause analysis tool that allows teams to investigate failure patterns, link corrective actions to specific assets, and track whether those actions improved MTBF in the months that follow.
When combined with MTBF trends and OEE data, this creates a closed improvement loop: identify degradation → investigate root cause → implement corrective action → measure the improvement → repeat. This is the systematic engine behind reducing both breakdown frequency and repair time across an entire facility. Teams using this loop consistently find that 20–30% of their breakdown events trace back to a handful of assets with identifiable, fixable root causes — and fixing those root causes delivers outsized improvements in both OEE and MTBF without any capital expenditure.
Pair this with the root cause analysis investigation checklist and your team has a structured, repeatable process for turning every major breakdown into a permanent improvement.
Cryotos connects directly to PLCs, SCADA systems, and IoT sensors through its IoT meter reading module, so equipment runtime data, vibration readings, temperature trends, and energy consumption flow into KPI calculations automatically — no manual entry, no data lag, no estimation. When a sensor detects a threshold breach, Cryotos creates a work order automatically, starts the BDH clock, and notifies the assigned technician via mobile, email, or WhatsApp.
For organizations running SAP, Microsoft Dynamics 365, or other ERP platforms, Cryotos’s ERP integration ensures that maintenance cost data, asset records, and work order history are synchronized between systems — so finance teams can see maintenance cost per asset in their reporting tools while maintenance managers see MTTR and MTBF in theirs, from a single shared data source.
Organizations that implement structured maintenance KPI programs consistently report reduced unplanned downtime, lower emergency repair costs, and better capital planning for asset replacement. According to Reliable Plant, every dollar invested in predictive and preventive maintenance delivers between $5 and $15 in avoided failure costs — a return that only becomes visible when the data exists to measure it.
More importantly, structured metrics change the conversation between maintenance and business leadership. When maintenance managers walk into a budget review with a dashboard showing MTBF improving quarter-over-quarter, OEE trending upward, and asset availability consistently above 90%, the conversation shifts from “justify your headcount” to “how can we invest further in this program?” The data turns maintenance from a cost centre into a measurable contributor to operational performance — and that shift in perception is worth as much as the downtime reduction itself.
Cryotos customers using structured KPI programs report a 30% reduction in unplanned downtime and 25% faster repair times — outcomes that translate directly into higher OEE, lower BDH, and a maintenance program that operations leadership trusts and funds.
The six core maintenance performance metrics are MTTR (Mean Time to Repair), MTBF (Mean Time Between Failures), OEE (Overall Equipment Effectiveness), BDO (Breakdown Count), BDH (Breakdown Hours), and Asset Availability percentage. MTTR measures repair responsiveness, MTBF measures equipment reliability, OEE captures total productive output, and BDO/BDH together reveal which assets consume the most maintenance resources.
A CMMS improves maintenance metrics by capturing work order timestamps automatically, calculating KPIs in real time from actual event data, and surfacing trends on live dashboards before managers need to run reports. Without a CMMS, metrics are calculated manually at month-end from incomplete spreadsheet data — which means problems are identified weeks after they could have been addressed. Cryotos calculates MTTR, MTBF, OEE, and availability continuously from live work order data, so maintenance managers act on current conditions, not historical reports.
A good MTTR varies by industry and asset type, but world-class manufacturing facilities typically target MTTR below 2 hours for critical production assets. The more meaningful benchmark is the trend: if your MTTR is declining month over month, your team is getting more effective regardless of the absolute number. If MTTR is rising, investigate parts availability, technician skill coverage, and whether work orders are being created at failure detection or after the fact.
Cryotos calculates OEE by combining three components: Availability (scheduled time minus downtime, divided by scheduled time), Performance (actual output rate versus theoretical maximum), and Quality (good units produced versus total units). Availability data comes from work order downtime records. Performance and Quality data can be entered manually by operators or connected automatically via IoT sensor integration. The OEE score updates in real time on the BI Dashboard as work orders are closed and meter readings are submitted.
MTBF (Mean Time Between Failures) applies to repairable assets — equipment that can be restored to service after a failure. It measures the average operating time between consecutive failures. MTTF (Mean Time to Failure) applies to non-repairable items — bearings, belts, filters, and other consumables — where the question is how long the item lasts before it must be replaced rather than repaired. Both metrics are available in Cryotos, with dedicated calculators accessible at cryotos.com/maintenance-metrics-calculator.
Maintenance metrics support budget justification by translating equipment condition and team performance into business-language numbers that finance and operations leadership understand. When a maintenance manager can show that MTBF on critical assets improved 40% after a PM programme investment, that OEE increased from 61% to 74% following a scheduled overhaul, and that BDH dropped by 300 hours in the quarter — the ROI on maintenance spending becomes concrete and defensible. Cryotos generates these reports on demand, with historical trend data that makes the before-and-after comparison clear.
If your maintenance team is still estimating KPIs from spreadsheets or calculating MTTR manually at month-end, you’re making decisions on data that’s already weeks old. Cryotos CMMS gives every maintenance manager live, accurate performance metrics — calculated automatically from real work order data, surfaced on configurable dashboards, and delivered to stakeholders on a schedule. Book a free demo today and see what your maintenance metrics look like when the data is real, current, and complete.



Cryotos AI predicts failures, automates work orders, and simplifies maintenance—before problems slow you down.



