Maintainability is the measure of how quickly and easily a failed asset can be restored to full working condition. In maintenance management, it’s one of the core reliability metrics — alongside MTBF and MTTR — that tells you how fast your team can recover from a breakdown. When maintainability is high, your repair times are short, your processes are efficient, and unplanned downtime stops eating into your production targets. When it’s low, every failure turns into a costly delay.
According to Reliability Education, poor maintainability accounts for up to 60% of unplanned downtime in manufacturing environments — not the failure itself, but the time it takes to respond and recover. Understanding maintainability gives maintenance managers a direct lever to pull when reducing downtime.

Maintainability is defined as the probability that a failed system or asset can be restored to its operational state within a specified period, under defined conditions. It’s not just about having skilled technicians — it covers the entire ecosystem of factors that determine how quickly a repair can happen: parts availability, documentation clarity, system design, diagnostic tools, and team procedures.
Think of it this way. Two machines break down at the same time. Machine A takes 45 minutes to repair because the failure is easy to diagnose, the parts are on the shelf, and the repair manual is clear. Machine B takes 6 hours because the fault is buried deep, the spare part needs to be ordered, and the repair steps aren’t documented. Machine A has high maintainability. Machine B does not.
Maintainability is closely tied to Mean Time to Repair (MTTR) — the average time it takes to restore an asset after a failure. A lower MTTR is the direct outcome of high maintainability. You can also link maintainability to downtime tracking, since every hour of downtime is a window into how maintainable your systems truly are.
Maintainability is expressed as a probability using the following formula:
M(t) = 1 − e^(−t/MTTR)
Where M(t) is the probability that a repair is completed within time t, MTTR is the Mean Time to Repair, and e is Euler’s number (≈2.718). The result tells you the likelihood that your team can restore an asset within a given time window.
Example: If your MTTR for a centrifugal pump is 4 hours, and you want to know the probability of completing the repair within 8 hours, the calculation is: M(8) = 1 − e^(−8/4) = 1 − e^(−2) = 1 − 0.135 = 0.865 or 86.5%. That means there’s an 86.5% chance the pump is back online within 8 hours. Use the MTTR calculator to track these values automatically from your work order data.
You can also track maintainability alongside MTBF to understand the full reliability picture — how often assets fail versus how fast you recover when they do.
Maintainability and reliability are often confused, but they measure completely different things. Reliability asks “how long will this asset run before it breaks?” Maintainability asks “once it breaks, how fast can we fix it?” Both matter for maximizing uptime, but they require different strategies.
| Aspect | Maintainability | Reliability |
|---|---|---|
| Definition | Probability of restoring an asset to operation within a set time after failure | Probability that an asset performs its function without failure over a given period |
| Key Metric | MTTR (Mean Time to Repair) | MTBF (Mean Time Between Failures) |
| Focus | Speed and ease of repair after a failure occurs | Preventing failure from occurring in the first place |
| Improvement Strategy | Better diagnostics, spare parts stocking, repair documentation | Preventive maintenance, design improvements, condition monitoring |
| Goal | Minimize downtime duration per incident | Minimize frequency of failures |
| Who Drives It | Maintenance planning, repair processes, parts inventory | Engineering, preventive maintenance schedules, asset quality |
High reliability with low maintainability means failures are rare but catastrophic when they happen. High maintainability with low reliability means you’re fast at fixing things but fixing them too often. The goal is to build both — and CMMS data gives you the numbers to work with on both fronts.

Maintainability doesn’t happen by accident. It’s shaped by a combination of equipment design choices, operational decisions, and maintenance infrastructure. Here are the main factors that determine how maintainable your assets are.
The Maintainability Index (MI) is a software metric that scores how easy code is to maintain — but in physical asset management, it’s adapted to score the overall repairability of equipment and systems. An MI score is typically expressed on a scale of 0–100, where higher values mean better maintainability. Here’s how to read the benchmarks.
| MI Score Range | Rating | What It Means | Action Required |
|---|---|---|---|
| 85–100 | Excellent | Assets are easy to repair, parts are available, documentation is clear | Maintain current practices |
| 65–84 | Good | Some friction points exist but repairs complete within acceptable timeframes | Target specific bottlenecks |
| 45–64 | Fair | Repair delays are common; documentation or parts gaps present | Audit repair process and stock levels |
| Below 45 | Poor | Significant structural or process issues causing long downtime events | Redesign maintenance program immediately |
Tracking maintainability scores per asset class over time — using MTTR trends from your CMMS — gives you a practical MI equivalent. If your average MTTR on a given machine type is climbing quarter over quarter, your maintainability is declining and intervention is needed before it drives major production losses.
Improving maintainability is a systematic process that touches people, processes, and tools. Here’s a practical approach that maintenance managers can implement without a massive capital spend.
A CMMS is the operational backbone of any serious maintainability improvement program. It turns the abstract concept of “faster repairs” into concrete, measurable actions across your entire facility.
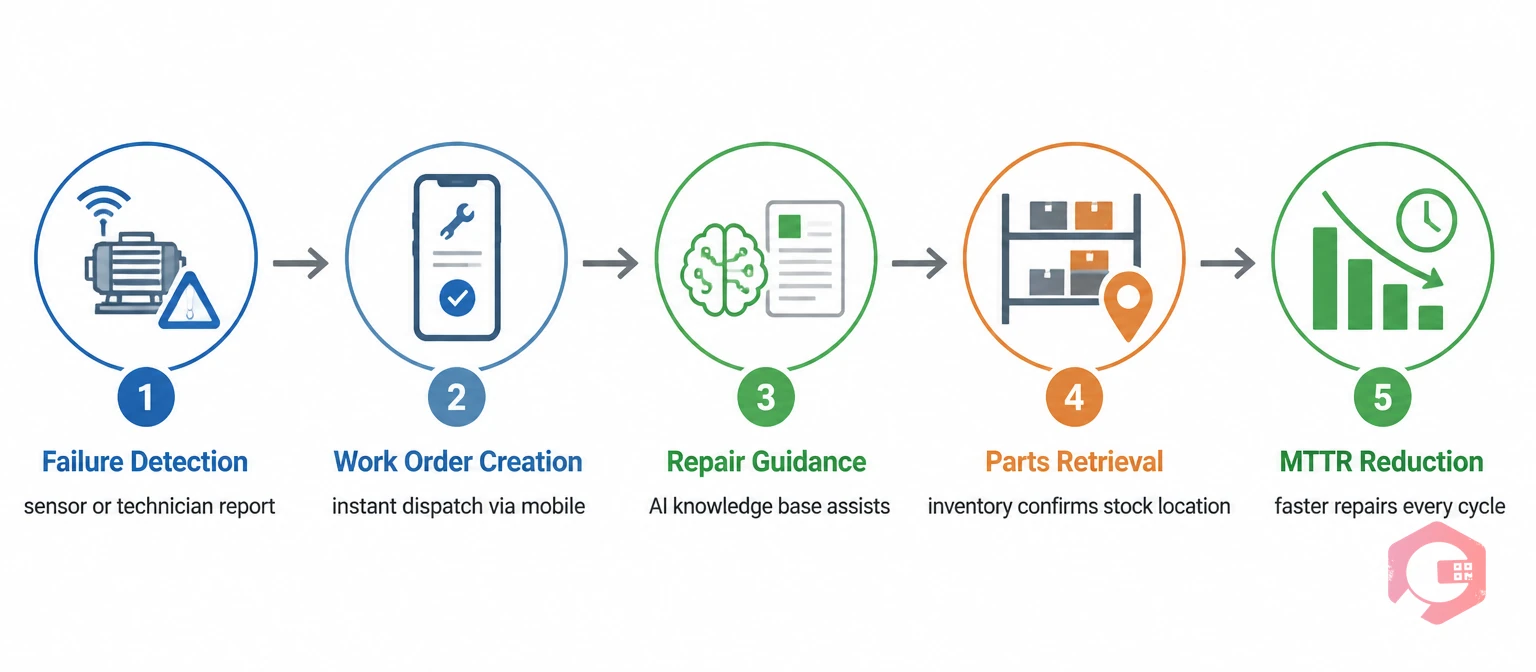
Cryotos CMMS gives maintenance teams a direct path to better maintainability through several tightly integrated features. The downtime tracking module captures every breakdown event in real time — logging the failure time, the start of repair, and the restoration time automatically. This gives you live MTTR data that you can slice by asset, department, or technician without any manual spreadsheet work.
When a failure occurs, Cryotos generates a work order instantly — via mobile, QR code scan, or WhatsApp — so the right technician is dispatched in minutes rather than hours. The AI-powered knowledge base surfaces relevant repair procedures and historical fix notes directly on the work order screen, so technicians don’t waste time hunting for documentation mid-repair.
On the inventory side, Cryotos tracks spare parts down to individual shelf locations and fires alerts when stock drops below minimum thresholds. Teams at companies like BorgWarner have used this capability to cut parts-related repair delays significantly. The result: measurably shorter MTTR, better maintainability scores, and 25% faster repairs on average across facilities using Cryotos CMMS.
If you’re serious about improving maintainability, the place to start is with accurate data. Cryotos CMMS gives you that data — and the tools to act on it.
Maintainability measures how quickly an asset can be restored after a failure. Availability is the overall percentage of time an asset is operational, combining both reliability (failure frequency) and maintainability (repair speed). You can have high maintainability and still have low availability if your assets fail too frequently. Both metrics together give the full picture of asset uptime performance.
A good MTTR depends heavily on the industry and asset type. For manufacturing equipment, best-practice MTTR targets are typically under 2–4 hours for non-critical assets and under 1 hour for production-critical machines. World-class facilities often target an MTTR under 30 minutes for their highest-priority assets by pre-staging parts and using standardized rapid-repair procedures.
Preventive maintenance primarily improves reliability by reducing failure frequency, but it also indirectly improves maintainability. Scheduled maintenance creates opportunities to inspect and correct issues that would make a future repair harder — such as corroded fasteners, missing documentation, or depleted spare parts. Teams running strong preventive maintenance programs typically achieve better maintainability scores because their assets are in better condition and better documented.
You can measure basic MTTR manually using maintenance logs and timestamps, but it’s time-intensive and prone to data gaps. Without a CMMS, you lose the ability to segment MTTR by asset type, failure mode, or team — which is where the actionable insights come from. A CMMS automates data capture at every step of the repair process, making maintainability tracking accurate and continuous rather than a monthly spreadsheet exercise.
Maintainability is one of the most directly actionable reliability metrics you have. Unlike MTBF — which depends heavily on asset age and design — your MTTR and maintainability scores respond quickly to operational changes. Smarter parts stocking, cleaner procedures, faster work order dispatch, and better diagnostic tools can all move your numbers within weeks. Cryotos CMMS brings all of those levers into a single platform — so your team spends less time reacting to breakdowns and more time preventing them.


Cryotos AI predicts failures, automates work orders, and simplifies maintenance—before problems slow you down.


