
A maintenance strategy for aging and end-of-life assets requires a structured decision between three options — repair, refurbish, or replace — based on actual cost data, failure history, and risk tolerance rather than gut feel or budget pressure alone. Choosing the wrong path costs more than just the immediate spend: a premature replacement wastes capital that could fund other improvements, while keeping a failing asset on life support drives up maintenance labour costs, parts spend, and unplanned downtime that compounds across every shift it runs.
This guide gives you a practical framework for making that call — with a decision matrix, financial thresholds, the signals that push each option, and how your CMMS data feeds every step of the analysis.

Assets don't fail on a straight line. Most industrial equipment follows a bathtub curve: a short infant-mortality period early in life, a long stable period with predictable failure rates, and then a wear-out phase where failures become more frequent, more expensive, and harder to predict. Once an asset enters the wear-out phase, the maintenance logic that worked for 10 years stops being cost-effective.
The wear-out phase shows up in your maintenance data before it shows up on the plant floor. Downtime tracking will reveal a rising frequency of unplanned stops on the same asset. Work order history will show repeat failures on the same components. MTBF — mean time between failures — will trend downward quarter over quarter. Repair costs per year will start climbing past 30–40% of the asset's replacement value, which is the industry threshold that signals a strategy change is overdue.
According to the Society for Maintenance and Reliability Professionals (SMRP), maintenance costs that exceed 3–5% of asset replacement value annually are a leading indicator of end-of-life transition. Plants that track this ratio by asset in their CMMS can catch the inflection point early enough to plan — rather than react — to the decision ahead.
Before applying a decision framework, it helps to be precise about what each option actually means, because the boundaries matter for cost estimation.
Repair restores a specific failed component or subsystem to working condition without changing the asset's overall configuration or performance. It addresses the immediate symptom — a failed bearing, a cracked housing, a blown motor winding — and returns the asset to service. Repair is the right call when the failure is isolated, the root cause is understood, and the rest of the asset is in good health.
Refurbishment goes further: it overhauls the asset back toward its design specification, replacing worn components proactively across multiple systems rather than just the one that failed. A refurbished asset typically gets new seals, bearings, electrical components, control systems, and any worn structural elements — the goal is to reset the asset's effective age and extend its service life by 5–10 years. Refurbishment costs 30–60% of a new asset's price but delivers a substantially better outcome than ongoing reactive repair.
Replacement means procuring and commissioning a new or substantially different asset to perform the same function. It carries the highest upfront cost, the longest lead time, and the most installation complexity — but it resets reliability, may deliver better performance or energy efficiency, and eliminates the parts-availability risk that often drives end-of-life decisions. The decision to replace should always be based on total cost of ownership (TCO) analysis, not just the sticker price of the new asset.
| Factor | Repair | Refurbish | Replace |
|---|---|---|---|
| Typical cost range | 5–20% of replacement value | 30–60% of replacement value | 100% + installation |
| Expected life extension | 1–3 years (failure-dependent) | 5–10 years | 15–25+ years (asset design life) |
| Downtime during work | Hours to days | Days to weeks | Weeks to months |
| Parts availability risk | High if OEM parts obsolete | Medium (wider sourcing options) | Low (new asset, current supply chain) |
| Performance outcome | Returns to prior (degraded) state | Returns to near-original spec | New or improved specification |
| Best trigger condition | Isolated failure, healthy rest of asset | Multiple worn systems, parts still available | Annual cost >40% replacement value; parts EOL; safety risk |
| Capital budget impact | Expense (OpEx) | Can be CapEx or OpEx depending on scope | Capital (CapEx) |
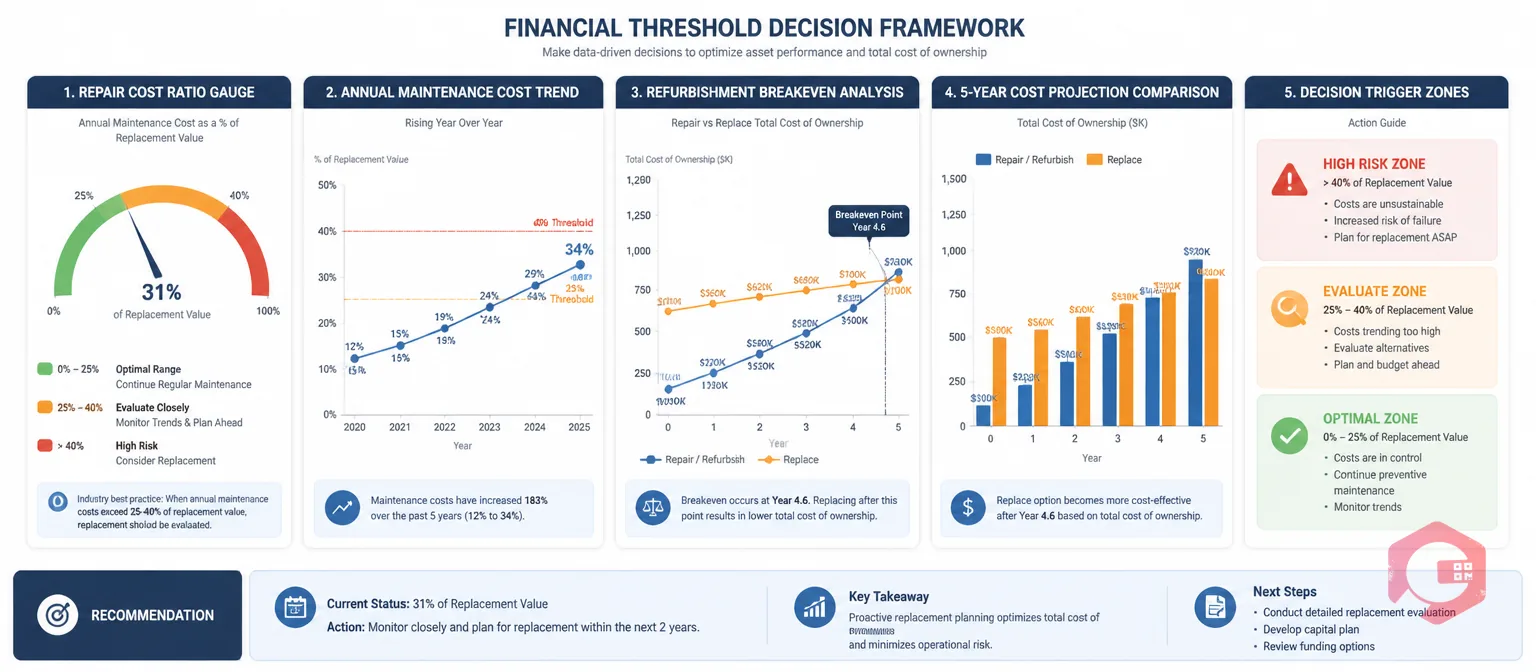
The most reliable single metric for the repair-or-replace decision is the repair cost ratio: the cumulative annual maintenance cost on a specific asset divided by its current replacement value. Most asset management frameworks — including guidance from ISO 55000, the international standard for asset management — use a threshold of 25–40% as the point where ongoing repair becomes economically irrational.
A second useful metric is the maintenance cost trend. If you plot annual maintenance spend per asset over 3–5 years and the line is rising year-over-year, that trajectory matters as much as the current year's absolute cost. A $15,000 asset spending $3,000 per year in maintenance (20% ratio) is acceptable; the same asset spending $3,000 this year but $1,500 last year and $500 two years ago is on a trajectory that will cross the threshold in 12–18 months — which is when you should be planning, not the day it crosses.
The refurbishment threshold sits below the replacement trigger: if cumulative repair costs are trending toward the 25–40% zone but OEM parts are still available and the asset's core structure is sound, refurbishment is often the most capital-efficient path. The breakeven test is straightforward — compare the cost of refurbishment plus projected 5-year maintenance costs against the cost of replacement plus 5-year maintenance on a new asset. If refurbishment wins that comparison with acceptable risk, it's the right call.
Your mean maintenance cost calculator and BI dashboard in Cryotos CMMS give you the per-asset cost history needed to run this analysis without manual data gathering. The 50+ built-in reports include asset cost trend views that surface the repair cost ratio automatically, so the decision can be data-driven rather than anecdote-driven.
Financial thresholds tell you when to act — failure patterns and operational context tell you which action to take. Here are the clearest signals for each path.
Repair is right when: the failure is genuinely isolated to a single component or subsystem, MTBF data shows the failure interval hasn't shortened significantly over the past 12–18 months, OEM or equivalent parts are readily available, and the rest of the asset has been recently inspected and found in good condition. Repair is also the correct immediate response in any emergency breakdown, even if a refurbish or replace decision is later appropriate — keeping production running while a longer-term plan is developed is a valid strategy as long as the costs are tracked against a planned timeline.
Refurbishment is right when: multiple subsystems are showing wear simultaneously, the asset's core structure (frame, housing, primary mechanical elements) is still sound, parts supply chains are still active, the asset type has a good track record of post-refurbishment reliability in your service conditions, and the plant cannot absorb the lead time or capital outlay of a full replacement in the current planning cycle. Industries with long-lead assets — heavy equipment, custom-built process machinery, large transformers — frequently find that a well-executed refurbishment delivers better value than waiting 18–24 months for a replacement.
Replacement is right when: annual maintenance costs exceed 40% of replacement value and show no sign of stabilising, OEM spare parts are no longer manufactured or have lead times exceeding acceptable downtime windows, the asset carries a safety or compliance risk that can't be adequately mitigated through maintenance, newer technology offers a step-change in energy efficiency or throughput that changes the economics over a 10-year horizon, or the asset has already been refurbished once and is approaching end-of-life again. A root cause analysis on recurring failures often surfaces the replacement case clearly — when the same failure mode returns within 6–12 months of a prior repair, the root cause is usually systemic age-related degradation that no targeted repair can solve.

Not every aging asset deserves the same depth of analysis. A structured review process starts by segmenting assets into criticality tiers — typically A (safety-critical or single-point-of-failure), B (significant operational impact but with some redundancy or workaround), and C (low-consequence, easily substituted). This criticality classification, which you can build and maintain in your asset tracking module, determines both how often an asset is reviewed and what analytical rigor the decision warrants.
Tier A assets need a full TCO analysis, risk assessment, and engineering sign-off before any repair/refurbish/replace decision. The stakes are too high for a quick judgment. Tier B assets warrant a financial threshold check (repair cost ratio plus trend) plus a condition assessment from the maintenance team. Tier C assets can often be managed on a simple rule: if the repair cost exceeds 50% of the replacement cost and the replacement is available off-the-shelf, replace it.
A practical cadence for most plants is a quarterly review of any asset whose trailing 12-month maintenance cost has exceeded 20% of its replacement value, with a full annual review of all Tier A and Tier B assets regardless of recent cost history. This review doesn't need to be a large project — a 30-minute session with the maintenance supervisor, the relevant technician, and the CMMS data is enough to make a sound decision on most assets. The asset inspection checklist provides a structured template for capturing the condition evidence that feeds the decision.
For plants managing large asset fleets, enterprise asset management software that integrates maintenance history, cost tracking, and condition data into a single view significantly reduces the time and effort needed to run these reviews consistently. The goal isn't a perfect model — it's a repeatable process that catches deteriorating assets before they become crises.
Parts availability is often the deciding factor that forces a replacement decision before the financial thresholds are reached. When an OEM discontinues parts, the maintenance cost of keeping an asset running escalates sharply — machining custom parts, sourcing from secondary markets, or adapting non-OEM alternatives all carry cost premiums and failure-mode uncertainty that don't show up in the repair cost ratio until damage is done.
Proactive obsolescence management means tracking parts status for all critical assets — particularly control system components, proprietary sensors, and specialist mechanical elements — and flagging when OEM support windows are closing. This information should live in your CMMS alongside the asset record, not in a spreadsheet that the one engineer who manages it carries in their head. The spare parts inventory software in Cryotos CMMS includes expiration and availability alerts that can be configured to notify the team when parts are approaching end-of-support status, giving a planning window for a refurbishment or replacement decision before the crisis hits.
A useful rule of thumb: if an asset has more than three components with no readily available OEM replacement and lead times exceeding 8 weeks, the replacement decision should be accelerated regardless of the current repair cost ratio. The risk isn't just the cost of the next failure — it's the production impact of a 12-week unplanned outage waiting for a part that may not arrive.
The most widely used threshold is 40–50% of the asset's current replacement value in cumulative annual maintenance costs. However, the trend matters as much as the absolute number — an asset at 30% but rising 8% per year should be reviewed now rather than waiting until it crosses 40%. Safety criticality and parts availability can move this threshold lower: a safety-critical asset with obsolete parts may justify replacement at 20–25%.
A well-executed overhaul typically adds 5–10 years of service life, depending on asset type and service conditions. The key word is "well-executed" — a refurbishment that addresses the immediate failures but misses other worn systems will deliver a shorter extension. A pre-refurbishment condition assessment that covers all major subsystems is what separates a 3-year extension from a 10-year one.
You need four things: total maintenance spend per asset over the trailing 12–24 months, MTBF trend for the asset over the same period, a list of all failure modes and their recurrence frequency, and the current replacement value of the asset (either from procurement records or a current vendor quote). If your CMMS isn't tracking maintenance costs at the individual asset level, that's the first gap to close — all other analysis depends on it.
Yes, and it's one of the highest-value uses of condition monitoring data. Continuous vibration, temperature, and current signature data on aging assets shows the degradation trend in real time, which gives far more precision to the "how long does this asset have left?" question than maintenance history alone. Plants using IoT meter reading integrated with their CMMS can set condition thresholds that automatically generate a review work order when an asset's degradation trend crosses a defined point — turning the decision from reactive to planned.
This is a real constraint in many plants, and the right response is to document the decision and its risk formally rather than pretend the threshold doesn't exist. A brief written record — "Asset X has exceeded the 40% repair cost threshold; replacement deferred to Q3 due to capital constraints; interim mitigation is increased inspection frequency and a 2-week parts reserve" — transforms an unavoidable business decision into a managed risk. It also protects the maintenance team if the asset fails catastrophically before the replacement is approved.
The repair-refurbish-replace decision is one of the most impactful choices in asset-intensive operations — the right call at the right time saves capital, reduces downtime, and extends the productive life of your plant. The wrong call, made on intuition rather than data, wastes both. Cryotos CMMS gives you the downtime data, maintenance cost history, asset condition records, and reporting tools to make this decision with confidence — not just at crisis point, but as part of a planned, repeatable asset lifecycle review. Book a free demo to see how Cryotos supports smarter decisions on aging assets.


Cryotos AI predicts failures, automates work orders, and simplifies maintenance—before problems slow you down.


