OEE benchmarks are the measurement standard that separates world-class manufacturing plants from average ones. Overall Equipment Effectiveness (OEE) measures exactly how productively your equipment runs during scheduled production time — capturing losses from unplanned downtime, speed reductions, and quality defects in a single percentage. A score of 85% or above is the globally accepted world-class benchmark, yet most factories start between 40% and 65%.
That gap is not just a number. It represents 35–60% of potential output being lost every shift to preventable causes. A facility running at 55% OEE with 5,000 scheduled production hours per year is quietly wasting 2,250 hours of capacity. At an average output value of even £100 per hour, that is £225,000 in unrealised production — every year. According to a McKinsey analysis of manufacturing operations, facilities that actively manage OEE as a primary KPI reduce maintenance costs by up to 25% and increase throughput by 10–20% within 18 months. The Society for Maintenance and Reliability Professionals identifies OEE measurement as a foundational element of maintenance and reliability best practice. And research from ISA-95 manufacturing enterprise integration standards confirms that facilities with real-time production monitoring consistently outperform those relying on end-of-shift manual reporting.
This guide covers every OEE benchmark tier, industry-specific targets, how to identify your biggest loss category, and a four-phase roadmap to close the gap — with practical guidance on the maintenance systems that make improvement stick.
Key Takeaways
World-class OEE is 85%+: Most facilities start between 40% and 65%. The gap represents tens or hundreds of thousands in unrealised production value per year.
OEE has three components: Availability, Performance, and Quality. Multiply them together to get your overall score. Targeting the right component determines which improvement strategy you apply.
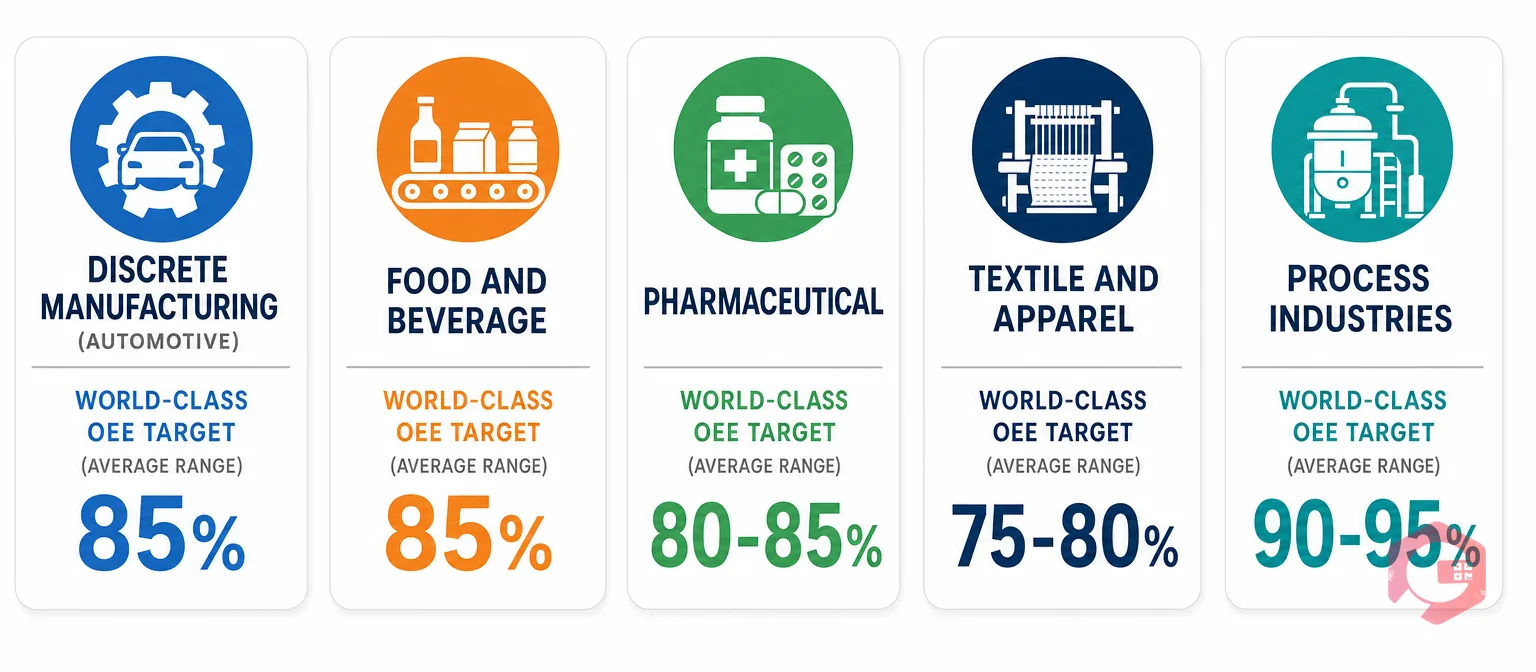
Industry benchmarks vary: Process industries target 90–95%. Discrete manufacturing targets 85%. Pharmaceutical targets 80–85%. Applying the wrong benchmark leads to misaligned expectations.
A four-phase approach works: Baseline → identify biggest loss → apply targeted strategy → monitor and sustain. Skipping Phase 1 is the most common reason OEE programmes stall.
CMMS accelerates every phase: Real-time downtime tracking, automated PM scheduling, and BI dashboards remove the data gaps that make OEE improvement guesswork.
What Is OEE and How Is It Calculated?
OEE stands for Overall Equipment Effectiveness. It is calculated by multiplying three components, each of which isolates a different category of production loss.
Availability measures what percentage of scheduled production time the equipment actually ran. Every minute of unplanned breakdown, emergency repair, or waiting time reduces Availability. Formula: (Run Time ÷ Planned Production Time) × 100.
Performance measures how close the equipment ran to its rated speed during the time it was running. Micro-stops, speed reductions, and idling all reduce Performance. Formula: (Ideal Cycle Time × Total Count ÷ Run Time) × 100.
Quality measures what percentage of output was defect-free on the first pass. Scrap, rework, and startup rejects all reduce Quality. Formula: (Good Count ÷ Total Count) × 100.
OEE = Availability × Performance × Quality. A machine running at 90% Availability, 95% Performance, and 99% Quality produces an OEE of just 84.6% — below world-class. This multiplication effect is why small losses in each component compound into a significant overall gap. Use the OEE calculator to run these numbers against your own production data before reading further — knowing your current score is essential for applying the right improvement strategy.
OEE Benchmark Levels: Where Does Your Plant Stand?
Poor OEE (Below 40%): A facility dominated by reactive maintenance and firefighting. Production losses are severe, data collection is inconsistent, and the maintenance team is perpetually behind. The first priority is stabilisation — not optimisation. Establish basic preventive maintenance and build reliable production data using a downtime tracking module. OEE improvement cannot begin until you can measure losses consistently.
Average OEE (40–65%): Most manufacturers globally operate in this range. Losses are real but often invisible — micro-stops not logged, speed reductions normalised by operators, quality issues resolved by rework rather than root cause elimination. Closing the gap from 55% to 70% often adds the equivalent of one extra production shift per week without any additional headcount or capital spend.
Good OEE (65–85%): Plants in this range have disciplined maintenance programmes and functioning PM schedules. Remaining losses tend to be harder to identify — gradual speed loss from wear, quality drift from process variation, and changeovers that could be shortened through SMED techniques. Structured root cause analysis and condition-based monitoring become the primary improvement tools at this tier.
World-Class OEE (85%+): Facilities at 85%+ run predictively. Preventive and condition-based maintenance drives near-zero unplanned stoppages. These plants have integrated IoT monitoring and a CMMS that auto-generates work orders from sensor alerts. World-class facilities spend 5–8× less on emergency repairs than reactive plants and maintain that advantage through sustained cross-functional discipline — not a one-time improvement event.
OEE Benchmarks by Industry
OEE benchmarks are not universal. The right target for your facility depends on your production model, changeover frequency, quality standards, and regulatory environment. Applying an automotive benchmark to a pharmaceutical batch process leads to misaligned expectations and the wrong improvement priorities.
Industry
Industry Average OEE
World-Class Target
Primary Loss Driver
Discrete Manufacturing (Automotive, Metal Fabrication)
65–75%
85%
Availability (breakdowns and changeovers)
Food and Beverage Processing
55–65%
85%
Availability (CIP and sanitation downtime)
Pharmaceutical Manufacturing
45–65%
80–85%
Quality (batch validation and compliance)
Textile and Apparel Manufacturing
50–65%
75–80%
Performance (thread breaks and speed losses)
Process Industries (Chemical, Refining)
70–85%
90–95%
Availability (unplanned stops carry severe consequences)
The Primary Loss Driver column is critical for prioritisation. A food and beverage plant chasing Quality improvements while its real losses come from CIP scheduling is solving the wrong problem. Match your improvement strategy to the primary driver for your industry before investing in any specific intervention.
Diagnosing Your OEE: Which Component Is Pulling You Down?
Before selecting an improvement strategy, you need to know whether your facility's OEE gap is primarily an Availability problem, a Performance problem, or a Quality problem. The diagnostic approach is the same regardless of your current OEE level: run a Pareto analysis on your production losses over 30–60 days and rank them by time impact.
If Availability is your primary loss: Your biggest opportunities are in reducing unplanned breakdown frequency and duration, eliminating setup and changeover time, and moving from reactive to planned maintenance. A BI dashboard that breaks down downtime by reason code, asset, and shift immediately surfaces which assets are responsible for the majority of Availability loss.
If Performance is your primary loss: Micro-stops and speed reductions are often hidden from traditional production tracking because they are too short to trigger formal downtime records. Total Productive Maintenance (TPM) cleaning, inspection, and lubrication routines — performed by operators rather than the maintenance team — are the proven intervention for Performance loss. These routines prevent the gradual deterioration in machine condition that causes speed losses to accumulate.
If Quality is your primary loss: Defect rates and first-pass yield are driven by process variation, tooling wear, material inconsistency, and operator error. In-process statistical process control, first-article inspection, and structured root cause analysis are the standard interventions. Quality losses frequently have an upstream cause in Availability or Performance — a machine running at 110% speed to recover after a breakdown will produce defects at a higher rate. Fix the root cause, not just the symptom.
The 4 Phases to Close the Gap Between Current OEE and World-Class
Phase 1 — Establish an Accurate Baseline: You cannot manage what you cannot measure. Deploy a manufacturing maintenance software system with integrated downtime tracking to capture every production loss in real time, categorised by reason code and asset. The first 30–60 days of accurate, structured data will reveal your real performance profile and make the Pareto analysis in Phase 2 possible. Plants that skip this phase and jump straight to improvement initiatives consistently report that their interventions target the wrong losses.
Phase 2 — Identify Your Biggest Loss Category: Run a Pareto analysis on your downtime reason codes. Rank losses by total minutes of impact over the baseline period. Is the majority of your gap in Availability, Performance, or Quality? Which five assets account for more than 50% of total losses? Which shifts show systematically higher or lower OEE? The Cryotos BI Dashboard surfaces this Pareto breakdown automatically — turning weeks of manual data analysis into a real-time view available every morning.
Phase 3 — Apply Targeted Improvement Strategies: For Availability losses, the solution is a structured PM programme that migrates from reactive to condition-based schedules. For Performance losses, operator-level autonomous maintenance routines targeting cleaning, inspection, and lubrication are the primary intervention. For Quality losses, implement in-process SPC checkpoints and formal root cause analysis workflows for every repeat defect. Apply overall equipment effectiveness as both the diagnostic framework and the outcome metric — so you can verify that your chosen strategy is producing results at the component level.
Phase 4 — Monitor, Track, and Sustain: OEE improvement is not a project with an end date — it is an ongoing operational discipline. Shift-level OEE reports reviewed by production supervisors every morning, automatic alerts when OEE falls below a set threshold, and monthly trend reviews against targets are the standard cadence at world-class facilities. Work order management software that auto-schedules recurring inspections and surfaces OEE trends removes the manual effort that causes review cadences to be skipped under production pressure.
How a CMMS Drives Sustainable OEE Improvement
A modern maintenance management system addresses each OEE component through specific, measurable mechanisms — not through generic maintenance management.
Availability: Automated preventive maintenance software scheduling eliminates the human memory dependency that causes PMs to be skipped under production pressure. IoT integration triggers condition-based work orders before failures occur. Real-time downtime logging by reason code turns anecdotal breakdown reports into structured data that Pareto analysis can act on.
Performance: Digital maintenance checklists built around autonomous maintenance routines standardise operator-level cleaning and inspection. Mobile work order completion from the machine floor — with QR code asset identification — makes compliance faster than paper workarounds.
Quality: Integrated work order management with 5 Whys root cause analysis fields captures causal data at the point of repair — not hours later in a debrief. Repeat failure tracking surfaces patterns that individual work orders cannot reveal.
The compounding effect matters most at scale. A facility managing 200 assets manually may only realistically sustain PM compliance on its 20 most critical. A CMMS scales PM compliance across every asset class simultaneously — which is the only way to drive OEE improvement across the whole facility rather than just on pilot equipment. Use the wrench time calculator to measure how much of your maintenance team's time is spent on actual productive work versus non-value-adding activities before and after CMMS implementation.
Frequently Asked Questions
What is a good OEE score in manufacturing?
A good OEE score depends on your industry, but the widely accepted world-class benchmark for discrete manufacturing is 85% or above. Most facilities globally start between 40% and 65%. An OEE of 65–85% is considered good and indicates a disciplined maintenance programme with meaningful room for further improvement. Process industries such as chemical refining target 90–95% due to the continuous nature of their production and the high cost of any unplanned stop.
What are the three components of OEE?
OEE is calculated by multiplying three components. Availability measures what percentage of scheduled production time the equipment actually ran. Performance measures how close the equipment ran to its rated speed during the time it was operating. Quality measures what percentage of total output was defect-free on the first pass. All three must be improved together — strong Availability with poor Quality still produces a disappointing overall OEE score.
How long does it take to improve OEE significantly?
Most manufacturing facilities with structured OEE improvement programmes see measurable gains within 90 days when the Phase 1 baseline is established correctly. Moving from 55% to 70% OEE typically takes 6–12 months of sustained effort. Reaching world-class 85%+ from an average baseline typically takes 18–36 months, requiring sustained cross-functional commitment across maintenance, production, and quality teams.
How often should OEE be measured?
Best-in-class facilities measure OEE at the shift level and review it every morning. Weekly trend reviews identify emerging patterns before they become entrenched losses. Monthly reviews compare actual OEE against targets by asset class and production line. Annual benchmarking against industry peers validates whether your improvement trajectory is keeping pace with competitive performance standards.
What is the difference between OEE and TEEP?
OEE measures equipment effectiveness during scheduled production time only. TEEP — Total Effective Equipment Performance — measures effectiveness against all available calendar time, including non-scheduled periods. TEEP is always lower than OEE because it accounts for shifts and periods when equipment is not scheduled to run. OEE is the standard operational KPI. TEEP is useful for capacity planning decisions about whether to add shifts or capital equipment.
Manufacturing excellence through OEE benchmarks is a proven, repeatable methodology — not an aspiration reserved for large enterprises. Cryotos CMMS gives maintenance and production teams the real-time OEE tracking, Pareto downtime analytics, automated PM scheduling, and mobile work order management to close the gap from wherever you are today. Schedule a free demo and see how your OEE improvement programme can deliver measurable results within the first quarter.