
Overall Equipment Effectiveness (OEE) is a manufacturing metric that measures how efficiently your plant uses its equipment by multiplying three components: Availability, Performance, and Quality. A plant running at world-class OEE of 85% or above loses minimal production to downtime, speed losses, and defects. Most facilities start in the 60–75% range — meaning 25–40% of productive capacity is being lost somewhere in those three pillars.
This guide breaks down what each OEE component actually measures, what causes each one to drop, the benchmarks that separate good plants from great ones, and how a CMMS tracks all three in real time so you can act on the data rather than just report it.
OEE stands for Overall Equipment Effectiveness. It was developed as part of the Total Productive Maintenance (TPM) methodology and gives you a single number that reflects the true productivity of a piece of equipment or an entire plant.
The formula is straightforward:
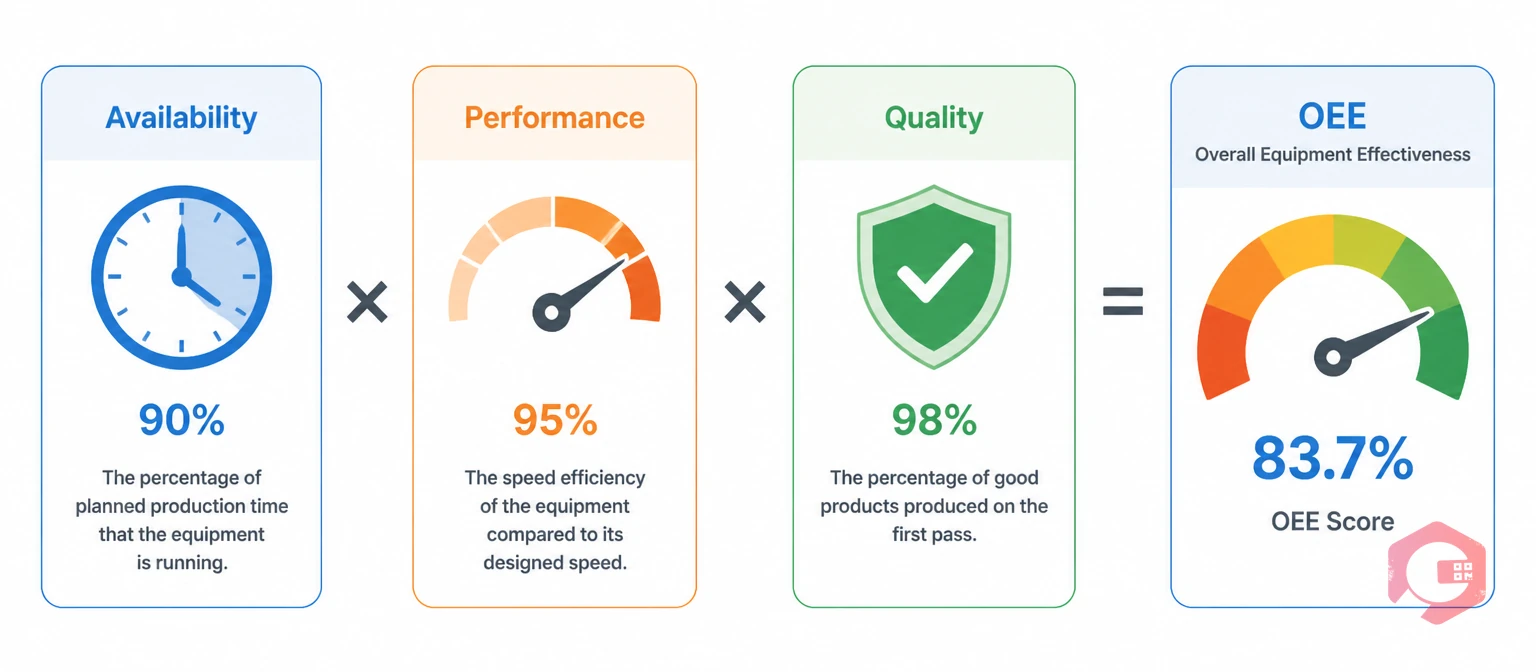
OEE = Availability × Performance × Quality
Each component is expressed as a percentage. If your equipment has 90% Availability, runs at 95% Performance, and produces 99% Quality output, your OEE is 0.90 × 0.95 × 0.99 = 84.6%. Miss any one of those targets by even a few percentage points and your OEE score drops fast — because the components multiply, not add.
That multiplication effect is exactly why OEE is so useful. A plant that looks fine on a surface-level uptime report can have a surprisingly low OEE once Performance and Quality losses are factored in. The OEE calculator makes it simple to plug in your numbers and see where the gap lives.
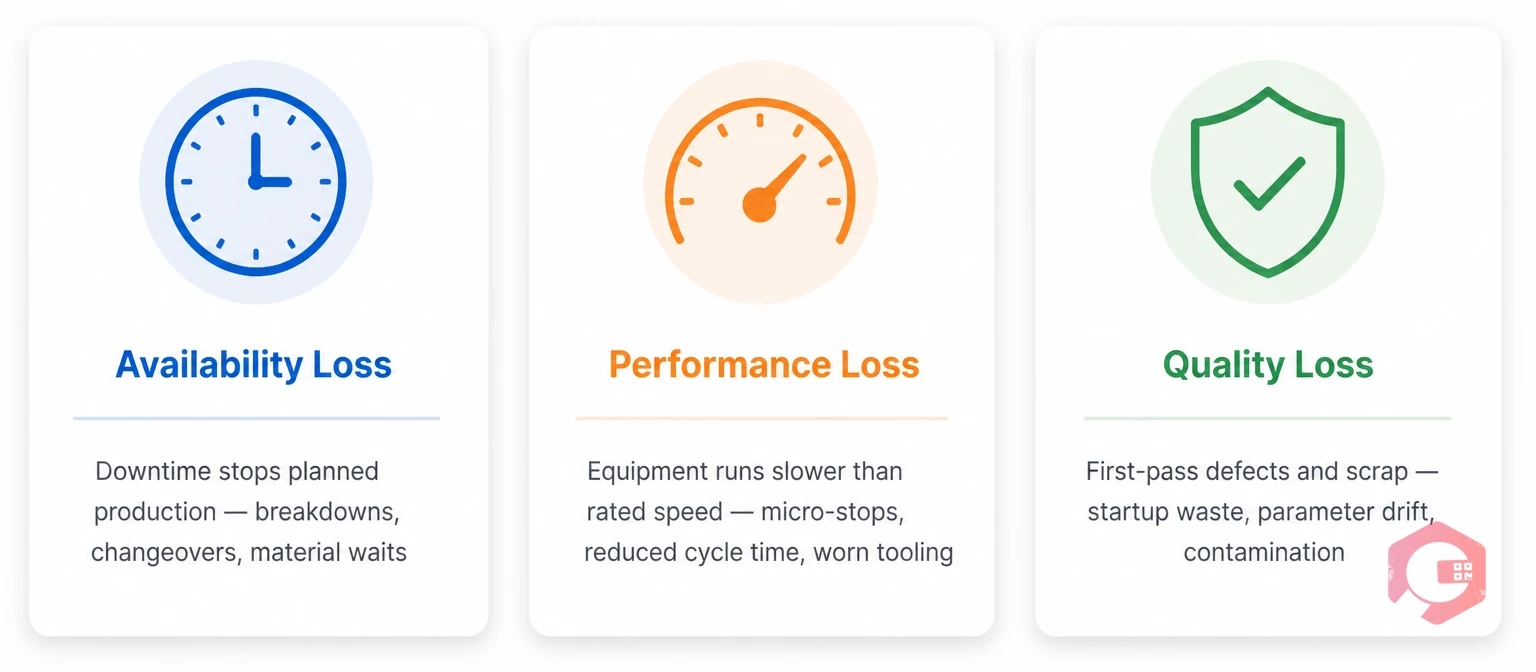
Availability measures the percentage of scheduled production time that your equipment is actually running. It accounts for all events that stop planned production — both planned and unplanned.
The formula is:
Availability = (Planned Production Time − Downtime) ÷ Planned Production Time × 100
If a machine is scheduled to run for 480 minutes per shift and suffers 60 minutes of downtime, Availability is (480 − 60) ÷ 480 = 87.5%.
Availability is the OEE component most maintenance teams focus on first — and for good reason. Downtime is visible, painful, and directly measurable. But understanding the type of downtime is what separates reactive plants from proactive ones.
The most direct lever is reducing unplanned breakdowns through structured preventive maintenance. Plants that maintain PM compliance above 90% for critical assets consistently report fewer emergency stoppages and shorter total downtime per shift. Root cause analysis using the 5 Whys method on every recurring breakdown stops the same failure from hitting Availability month after month.
Changeover time reduction is the second lever. Running structured SMED (Single-Minute Exchange of Die) analysis on your most frequent changeovers often cuts setup time by 30–50% without any capital investment — just better sequencing and pre-staging.
Performance measures how fast your equipment runs compared to its maximum designed speed during the time it is actually running. It captures losses from slow cycles and brief stops that individually seem minor but accumulate into significant production loss over a shift.
The formula is:
Performance = (Ideal Cycle Time × Total Count) ÷ Run Time × 100
If a machine should produce one unit every 10 seconds (ideal cycle time) but is actually averaging one unit every 13 seconds, Performance is 10 ÷ 13 = 76.9%. That 23% gap represents production that should have happened but did not — without a single alarm firing or operator raising a flag.
Performance losses are often the most underreported OEE component because they do not trigger work orders. Equipment is running, so nobody writes up a fault. But a machine running at 80% of its rated speed all shift produces 20% less output than it should — a loss that shows up in production shortfalls, not maintenance logs.
The first step is making micro-stops visible. IoT sensors on production equipment can detect every stoppage — even a 30-second auto-clear pause — and log it with a timestamp. Over a week of data, you see exactly which assets have the most frequent micro-stops and at what points in the shift they cluster. Cryotos connects to IoT meter readings and SCADA systems to bring this data into work orders automatically.
Operator rounds with structured equipment checks catch speed reductions before they become patterns. A checklist that includes actual output count versus target at the midshift point gives supervisors the data to intervene — not just report the loss at shift end.
Quality measures the proportion of total production that meets specification on the first pass — without rework, scrap, or second-chance inspection. It is the OEE component that connects maintenance performance directly to product quality, and it is frequently underweighted by maintenance teams who see quality as a production department concern.
The formula is:
Quality = Good Count ÷ Total Count × 100
If a machine produces 950 good units from 1,000 total units, Quality is 95%. The 50 units that were scrapped or reworked represent lost material, lost machine time, and in some cases lost delivery commitments — all hidden from the OEE Availability and Performance numbers because the machine kept running throughout.
Structured root cause analysis on recurring quality defects almost always traces back to equipment condition issues. A team that investigates a quality spike by looking at maintenance history — not just production records — finds the maintenance trigger faster. Was there a changeover? A recent repair? A PM task that was late or skipped?
Condition monitoring on process-critical parameters — temperature, pressure, vibration — catches the drift before it becomes defects. Condition-based maintenance strategies that trigger inspection when a parameter approaches its tolerance boundary prevent quality losses at the source.
Understanding your OEE number is more useful when you compare it against industry benchmarks. World-class OEE of 85% is the commonly cited target, but the practical benchmarks vary significantly by industry, equipment type, and production model.
| Industry | Typical OEE Range | World-Class Target | Biggest Loss Driver |
|---|---|---|---|
| Discrete Manufacturing | 55–75% | 85% | Changeover and setup time (Availability) |
| Food and Beverage | 60–75% | 85% | Startup scrap and cleaning downtime (Quality + Availability) |
| Pharmaceutical | 65–80% | 90% | Batch changeover and compliance documentation (Availability) |
| Automotive | 70–80% | 85% | Micro-stops and speed loss (Performance) |
| Continuous Process | 75–85% | 90–95% | Unplanned shutdowns (Availability) |
The 85% world-class benchmark assumes Availability of 90%, Performance of 95%, and Quality of 99.9%. That combination is achievable but requires active management of all three components simultaneously. Most plants that measure OEE for the first time discover their actual Performance and Quality scores are lower than they estimated — because those losses were never systematically captured before.
According to McKinsey research on maintenance digitization, manufacturers that implement structured OEE tracking see 10–20% improvement in equipment uptime within the first 12 months of deployment — simply because measurement drives visibility, and visibility drives action.
Tracking OEE manually is possible for a single machine over a single shift. At scale — across a plant with 50 or 100 assets running multiple shifts — manual OEE tracking produces data that is always late, often inaccurate, and too aggregated to act on.
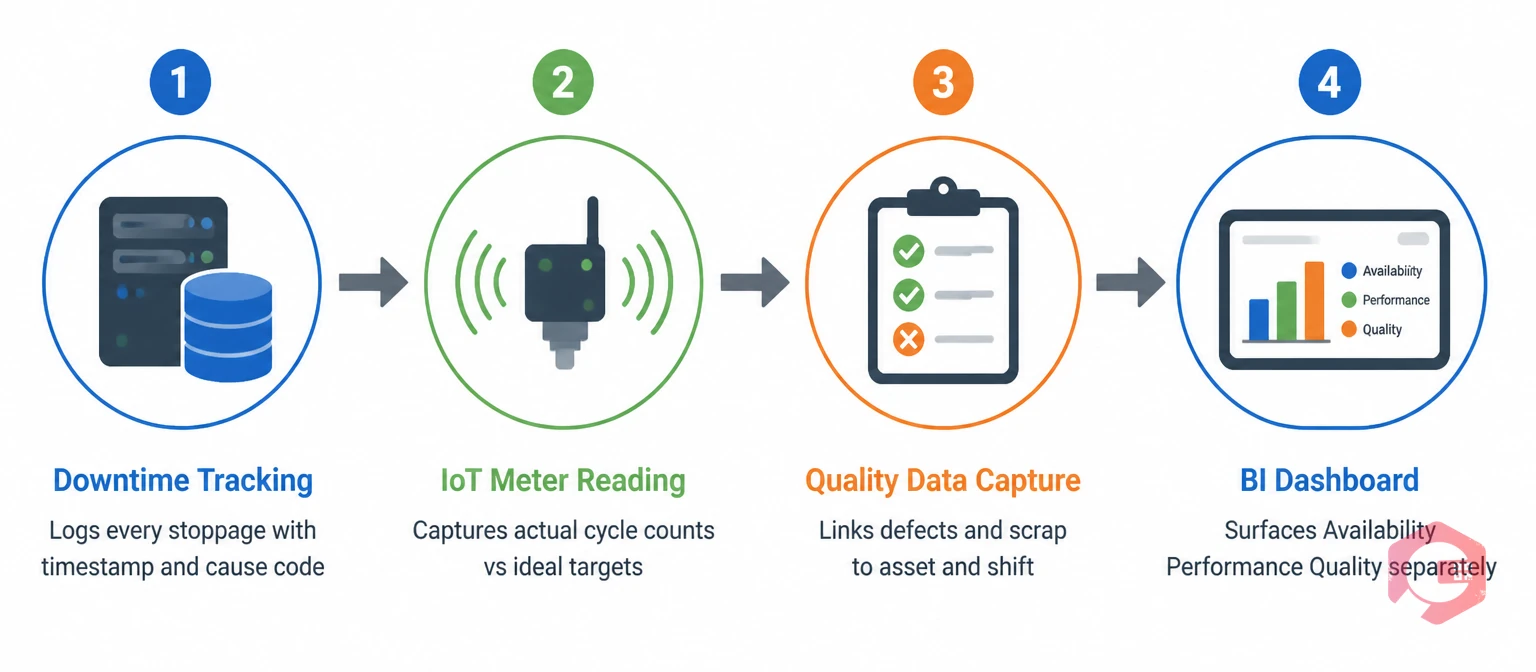
A CMMS connected to downtime tracking and IoT sensors changes that. Here is how each OEE component maps to specific CMMS capabilities:
Cryotos's BI Dashboard surfaces OEE, Availability, Performance, and Quality as individual tracked metrics — not just a blended score. That separation is critical. A blended OEE of 70% tells you there is a problem. Seeing that Availability is 88%, Performance is 82%, and Quality is 97% tells you exactly where to focus the improvement effort.
Maintenance teams using Cryotos report a 30% reduction in downtime and 25% faster repair times — outcomes that flow directly into Availability improvements that lift the overall OEE score. For manufacturing facilities trying to close the gap to world-class OEE, the data visibility a CMMS provides is the starting point, not an optional extra.
If your plant is tracking OEE as a single number without visibility into each component, you are managing symptoms rather than causes. Cryotos gives maintenance and operations teams the real-time data to manage Availability, Performance, and Quality as separate, actionable metrics — and the work order infrastructure to act on what the data shows. Book a free demo at cryotos.com and see how OEE tracking works across your asset base.
World-class OEE is generally considered to be 85% or above for discrete manufacturers. Most facilities measure between 60% and 75% when they first start tracking OEE systematically. A score below 65% typically indicates significant unmanaged losses in at least one of the three components. Rather than targeting 85% immediately, most plants see the best results by identifying which single component — Availability, Performance, or Quality — has the largest gap and improving that one first.
OEE measures equipment effectiveness during scheduled production time only. TEEP (Total Effective Equipment Performance) extends this to all calendar time — including planned shutdown periods, weekends, and holidays. TEEP is always lower than OEE and is used when a plant is evaluating whether to add production shifts or invest in additional equipment capacity.
Performance is typically the hardest to improve because Performance losses — micro-stops, reduced speed — are the least visible. They do not trigger alarms or work orders, so they require active monitoring through IoT sensors or structured operator rounds to detect. Availability and Quality losses are more visible and usually addressed first, but sustained OEE improvement requires closing the Performance gap too.
For effective improvement programs, OEE should be measured at shift level — not just daily or weekly. Shift-level data lets supervisors see patterns by time of day, operator team, or shift changeover that daily aggregates hide. Most CMMS platforms with downtime tracking can calculate and display shift-level OEE automatically once the data inputs are connected.
Yes, technically — if actual cycle times are faster than the ideal cycle time used in the calculation. This usually means the ideal cycle time baseline was set too conservatively. An OEE above 100% is a signal to review and update the ideal cycle time, not a reason to celebrate. Accurate ideal cycle times should come from the original equipment manufacturer's specifications, not from historical average performance.


Cryotos AI predicts failures, automates work orders, and simplifies maintenance—before problems slow you down.


