
Real-time OEE monitoring is the practice of tracking Overall Equipment Effectiveness — Availability, Performance, and Quality — continuously using live sensor and machine data, rather than calculating it manually at the end of a shift or day. When your OEE data arrives in real time, your maintenance and operations teams can act on developing losses as they happen. When it arrives hours or days later, you are managing the aftermath of problems you could have prevented.
According to a McKinsey report on maintenance operations, manufacturers that shift from reactive to predictive maintenance reduce unplanned downtime by up to 50% and cut maintenance costs by 10–25%. Real-time OEE monitoring is the operational data layer that makes that shift possible. This guide explains exactly why the timing of your OEE data determines whether your operation stays reactive or becomes predictive.
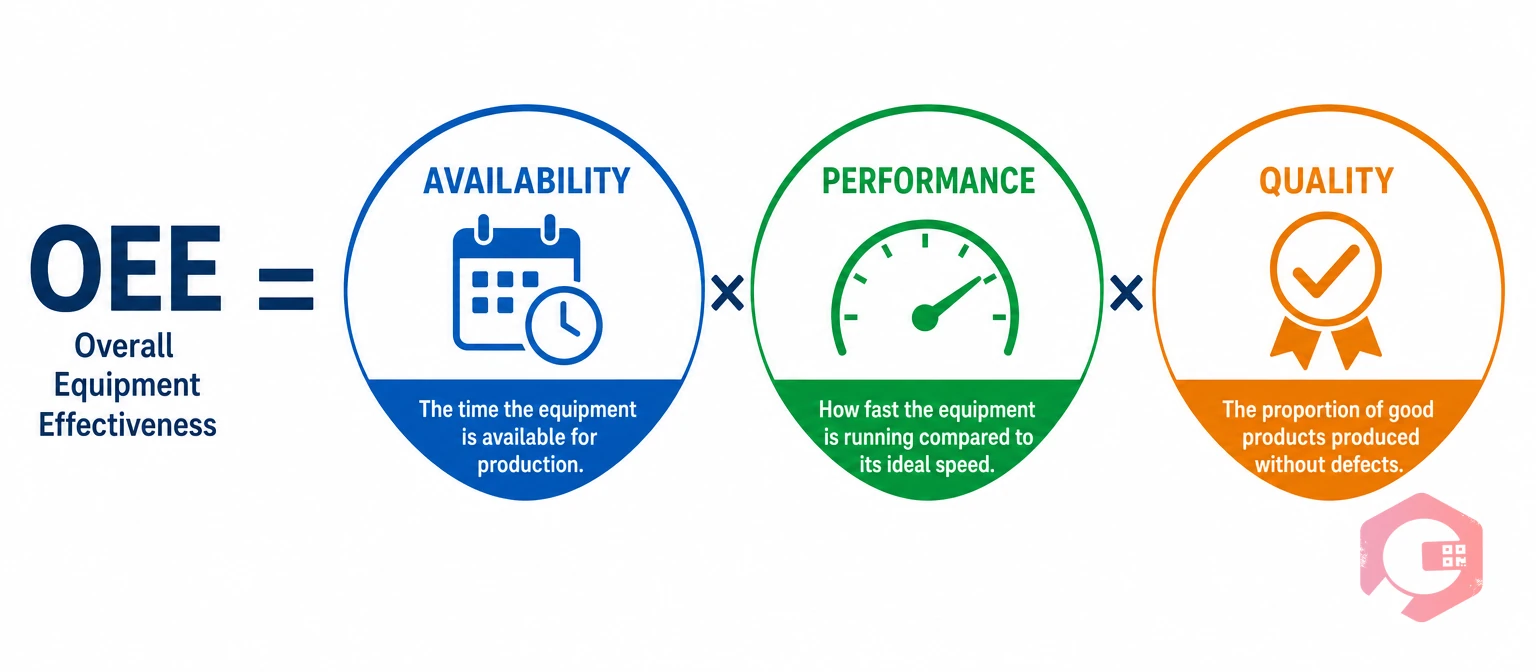
Overall Equipment Effectiveness is the standard metric for measuring manufacturing productivity. It combines three factors: Availability (how much of the planned production time was the equipment actually running), Performance (how fast it was running compared to its rated speed), and Quality (how much of its output was first-pass acceptable). A perfect OEE score is 100%, and world-class manufacturing typically achieves 85% or above.
Traditional OEE calculation happens after the fact — a supervisor collects shift logs, counts defects, tallies downtime events, and produces a report the next morning or at the end of the week. By that point, the root cause of a performance drop has often reset itself, the machine operators who were present have moved on, and the opportunity to intervene has passed.
Real-time OEE monitoring replaces that delayed reporting cycle with a live data stream. Sensors connected to your equipment feed Availability, Performance, and Quality data continuously into your maintenance management system. Your team sees OEE dropping as it drops — not after it dropped.
In a real-time system, each OEE component is captured differently. Availability is tracked by machine state signals — a PLC or SCADA system logs the exact moment a machine stops and the moment it restarts, calculating actual run time against planned production time without any manual data entry. Performance is measured by comparing actual cycle time against the ideal cycle time for the product currently running — IoT speed sensors or pulse counters feed this data continuously. Quality is captured by integrating the real-time OEE system with your production line’s inspection points, counting accepted versus rejected units as they come off the line.
The result is an OEE score that updates every few minutes rather than every few shifts. When Availability drops because a conveyor jammed, your CMMS sees it within seconds. When Performance slips because a worn cutting tool is slowing cycle times, your maintenance dashboard flags it before it costs you an hour of lost throughput.
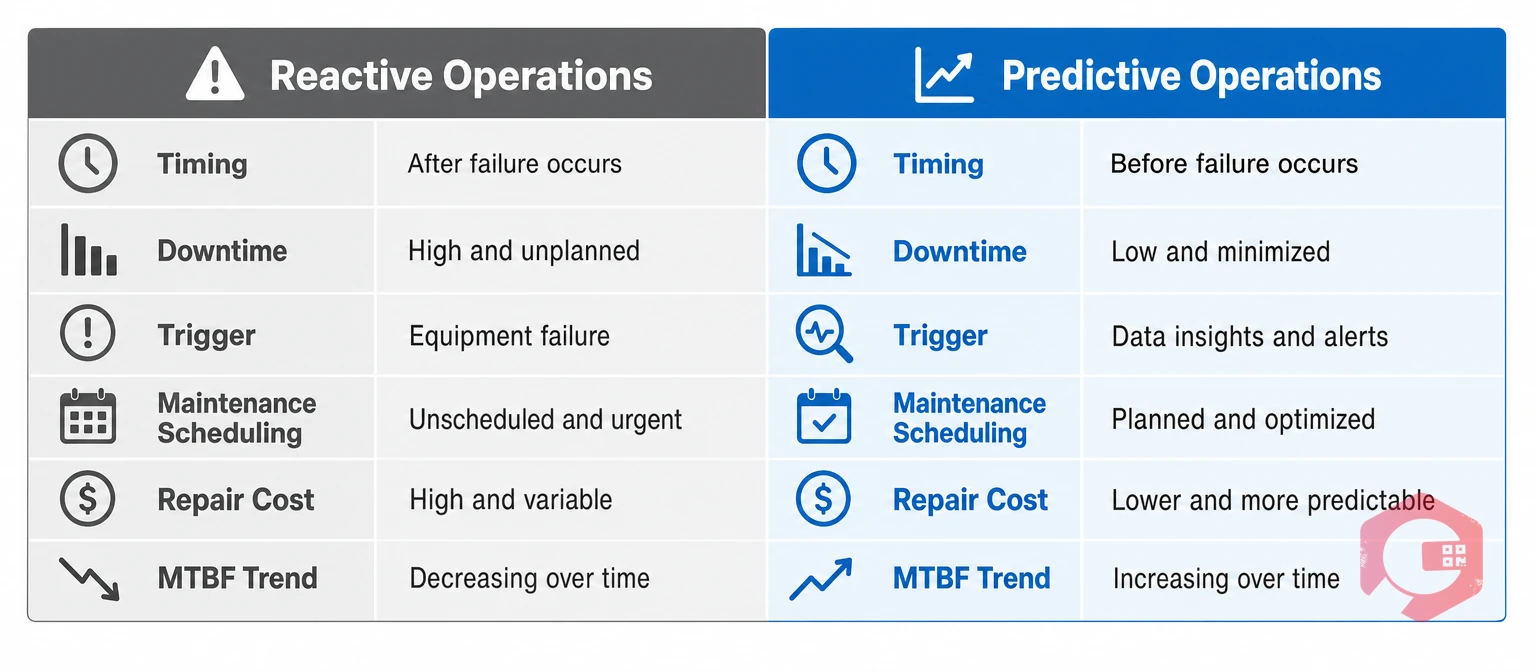
The difference between reactive and predictive operations is not a philosophy — it is a measurable gap in how quickly your team turns data into action. Reactive operations are defined by their information latency: a problem exists, grows, and becomes expensive before anyone with the authority to fix it even knows it happened. Predictive operations close that latency gap by connecting equipment data directly to maintenance workflows in real time.
Here is how the two operational states compare across the dimensions that matter most to production and maintenance leaders:
The gap between these two states is not primarily a technology problem — it is a data latency problem. Real-time OEE monitoring is what closes it.
The most common form of OEE tracking in manufacturing today is still the end-of-shift manual log. An operator fills in a paper or spreadsheet record of downtime events, production counts, and scrap quantities. A supervisor compiles it. A manager reviews it the next day. By then, three things have typically happened: the equipment causing the OEE loss has either self-recovered or failed completely, the context that would have pointed to root cause is gone, and the same loss pattern has repeated on the next shift.
There is a structural reason lagging data keeps operations reactive. When your OEE reports arrive hours after the loss occurred, you are always in analysis mode rather than intervention mode. Your team reviews what happened yesterday instead of preventing what is happening now. Improvement meetings become post-mortems rather than real-time decision sessions.
Consider a practical example. A high-speed packaging line loses 12% OEE on a Tuesday afternoon because a film tension sensor is drifting, causing intermittent speed reductions and sealing defects. With end-of-shift reporting, this shows up in Wednesday morning’s report as a Performance and Quality loss. By that point, the sensor has been replaced or has failed completely, resulting in an unplanned stoppage. The cost of that stoppage — emergency parts sourcing, extended repair time, production loss — is three to five times higher than a scheduled intervention would have been.
With real-time OEE monitoring, the Performance drop flags itself on the dashboard within minutes of the first speed deviation. A work order is raised. A technician checks the sensor during a scheduled micro-stoppage. The issue is resolved before it becomes a failure. The OEE loss is measured in percentage points, not hours.
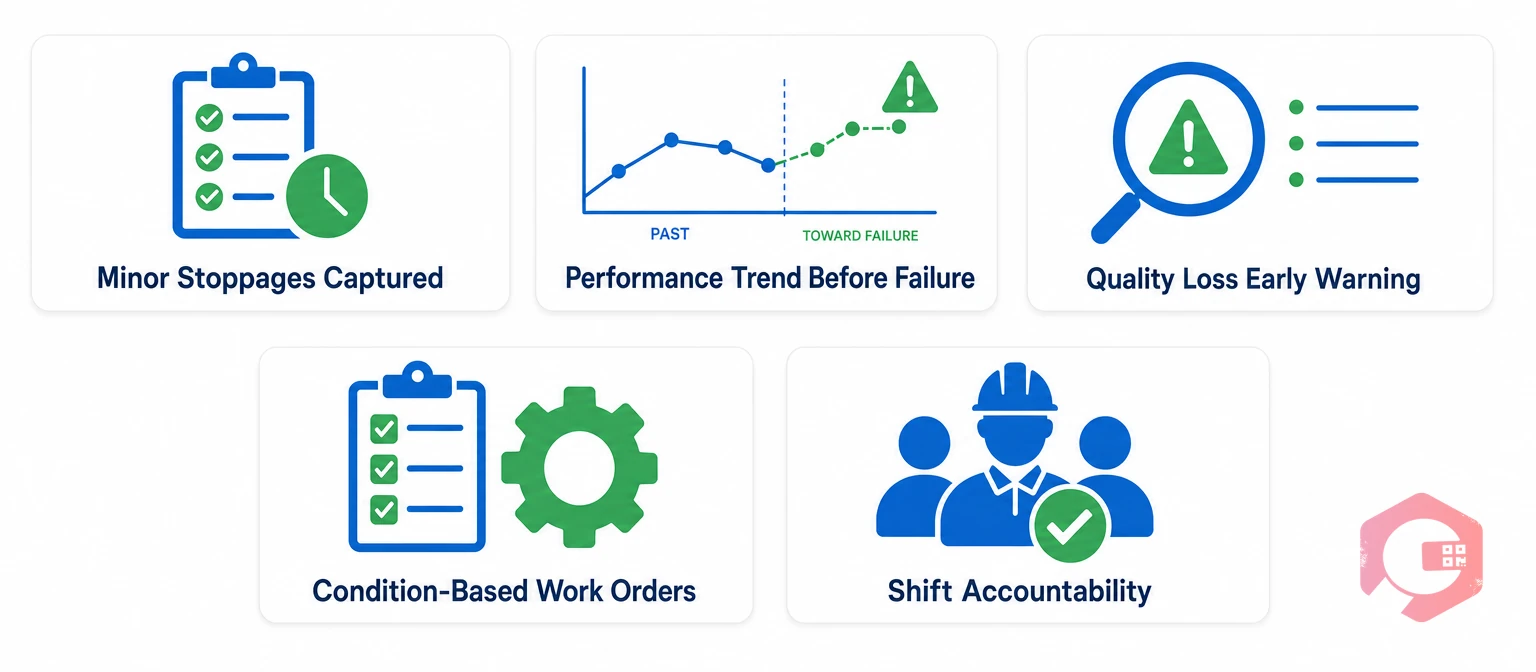
Shifting from reactive to predictive operations is not a single decision — it is a set of operational changes that real-time OEE data makes possible. Here are the five most significant:
Understanding real-time OEE in theory is straightforward. Understanding what it looks like inside an actual production environment — and what it requires to work — is what separates facilities that implement it successfully from those that buy the technology and abandon it.
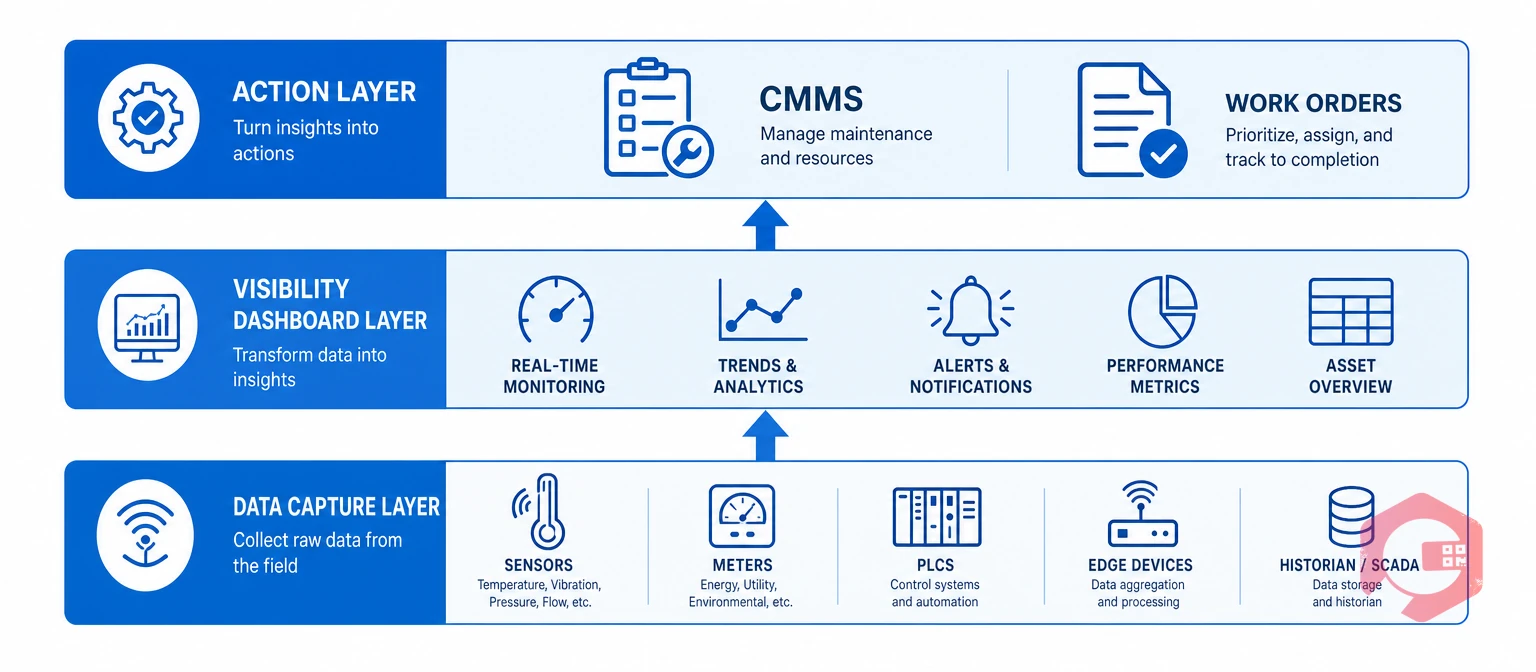
In practice, a real-time OEE monitoring system involves three layers working together. The first is the data capture layer: sensors, PLCs, SCADA systems, or edge devices that detect machine state, speed, and quality in real time. This layer does not require replacing your equipment — in most cases, your existing control systems are already generating the signals that a real-time OEE platform needs. The integration work is connecting those signals to a monitoring layer that can interpret them.
The second layer is the visibility layer: a live OEE dashboard that displays current OEE by asset, line, and plant. This is what your production and maintenance teams see during their shifts — a number that is current, not historical. A well-designed dashboard shows not just the current OEE score but the component driving the loss (Availability, Performance, or Quality) and the trend over the past hour. This gives supervisors enough context to make decisions without needing a report.
The third layer — the one that turns monitoring into management — is the action layer: a downtime tracking and work order system that connects the OEE signal to a maintenance response. When the dashboard flags an Availability loss, a work order is created. When a Performance trend crosses a threshold, a planned maintenance inspection is scheduled. When a Quality loss recurs on the same asset across three consecutive shifts, a root cause analysis task is assigned. Without this action layer, real-time OEE monitoring produces better-informed post-mortems but does not change operational behavior.
According to the ISO 55000 asset management standard, the goal of any monitoring system is not measurement for its own sake — it is enabling informed decisions at the operational level. Real-time OEE monitoring only delivers value when the data flows through to those decisions.
A real-time OEE platform without a connected maintenance management system produces dashboards, not improvements. The data tells you something is wrong. The CMMS is what ensures something gets done about it.
When Cryotos CMMS is connected to your OEE data stream, the workflow from signal to action becomes automatic. An Availability drop on a specific asset triggers a downtime event in Cryotos, which can automatically generate a work order assigned to the maintenance team responsible for that line. A Performance threshold breach triggers a preventive maintenance inspection, pre-populated with the asset history, applicable checklist, and any open work orders already in the queue. A recurring Quality loss on the same asset three shifts in a row can trigger a structured 5 Whys root cause investigation — a feature built directly into the Cryotos work order flow.
The Cryotos BI Dashboard takes this further by tracking OEE trends alongside maintenance KPIs — MTTR, MTBF, and downtime by asset, department, and plant. This correlation is where the shift from reactive to predictive becomes visible in the data: as maintenance teams respond faster to real-time OEE signals, MTBF improves and unplanned downtime decreases. The dashboard makes that improvement measurable and reportable.
Cryotos also connects to IoT sensors via SCADA and PLC integration, allowing condition-based triggers — not just OEE threshold alerts — to flow directly into the maintenance workflow. When a vibration sensor on a motor crosses its alert threshold at the same time that OEE Performance drops by 8%, the combination triggers a higher-priority work order than either signal would generate alone. You can also use the Cryotos OEE calculator to benchmark your current OEE against world-class targets and identify where real-time monitoring would deliver the most immediate impact.
Cryotos customers report a 30% reduction in downtime and 25% faster repair times — results that depend directly on the speed of the connection between OEE data and maintenance action. The faster your team converts an OEE signal into a work order, the less that signal costs you in lost production.
Traditional OEE reporting calculates Overall Equipment Effectiveness from manually collected shift data after production has ended — typically the next morning or end of week. Real-time OEE monitoring uses sensor data and machine state signals to update OEE continuously, allowing teams to see losses as they develop and intervene before they become major stoppages. The key difference is latency: traditional reporting produces historical analysis, while real-time monitoring enables current-state intervention.
Real-time OEE monitoring provides the continuous equipment performance data that predictive maintenance requires. When OEE drops — particularly in the Performance and Availability components — it signals developing mechanical issues before they become failures. Connected to a CMMS, these OEE signals trigger condition-based work orders automatically, enabling maintenance teams to act on real equipment condition rather than a fixed calendar schedule. This is the operational mechanism that shifts a facility from reactive to predictive maintenance.
Most manufacturing facilities already have the data sources needed: PLCs, SCADA systems, and production counters that generate machine state and cycle time signals. Real-time OEE monitoring connects to these existing sources via IoT gateways or direct SCADA/PLC integration — typically without requiring new equipment. The key additions are an OEE monitoring platform to process and display the data, and a CMMS to convert OEE signals into maintenance actions.
World-class OEE is generally considered to be 85% or above. Most manufacturers operate between 60–70% OEE, which means significant productivity opportunity exists. Real-time monitoring improves OEE by reducing the time between a loss occurring and a maintenance response being triggered. Research from industry benchmarking consistently shows that facilities with real-time visibility resolve OEE losses 40–60% faster than those relying on end-of-shift reporting — directly translating into higher Availability, Performance, and Quality scores over time.
A CMMS is the action layer for OEE data — it converts OEE signals into work orders, tracks maintenance responses, and measures the impact of maintenance activities on equipment performance over time. A dedicated OEE platform or IoT integration layer typically handles the data capture and visualization layer. The two systems work together: the OEE platform generates the real-time signals, and the CMMS ensures those signals drive maintenance action. Cryotos integrates with IoT and SCADA sources to support this combined workflow.
Real-time OEE monitoring is not a reporting upgrade — it is an operational shift. When your OEE data is live, your maintenance team stops managing yesterday’s failures and starts preventing tomorrow’s. Book a free Cryotos CMMS demo today and see how real-time OEE data connects directly to maintenance action across your production lines.


Cryotos AI predicts failures, automates work orders, and simplifies maintenance—before problems slow you down.


