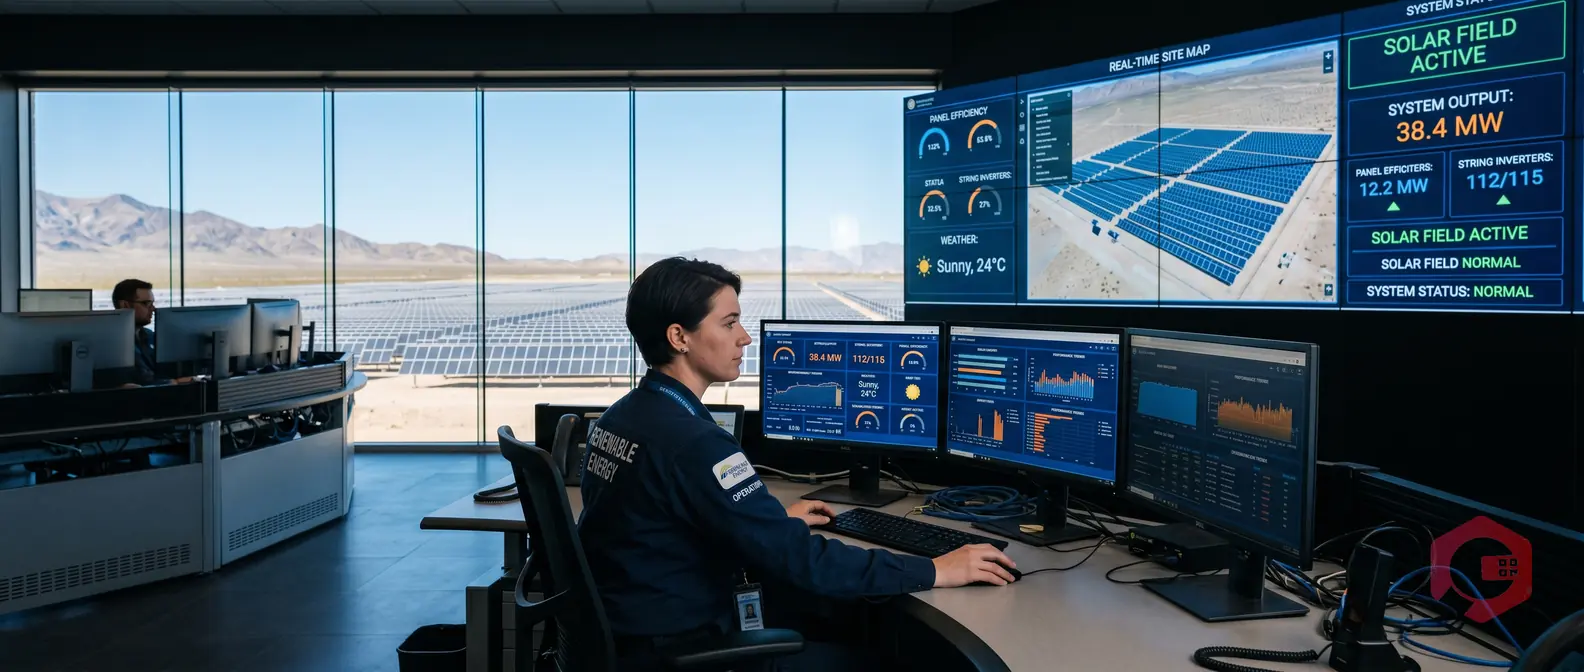
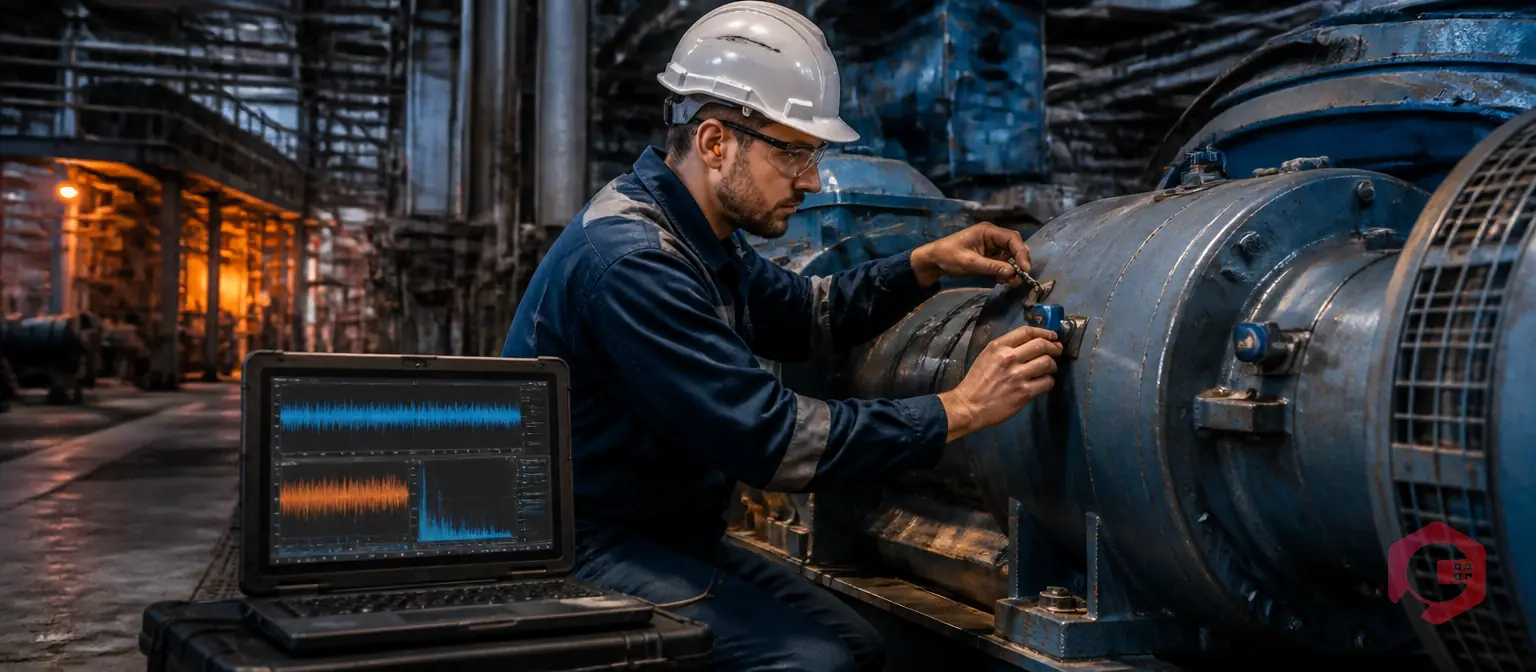
SCADA integration for solar power plant monitoring connects your plant’s sensors, inverters, and field devices to a centralized control system that collects, visualizes, and acts on real-time operational data. A well-integrated SCADA system lets your O&M team catch performance drops before they become failures — turning raw telemetry into scheduled work orders, dispatched technicians, and resolved faults.
According to the International Renewable Energy Agency (IRENA), O&M costs account for 20–25% of a solar plant’s total lifetime cost, and undetected faults are the leading driver of unplanned downtime. This guide covers everything your team needs to know: what solar SCADA monitors, which protocols to use, how to connect SCADA to a CMMS, and the step-by-step process for building a monitoring setup that actually reduces downtime.
Key Takeaways
SCADA — Supervisory Control and Data Acquisition — is the backbone of modern solar power plant monitoring. It collects real-time data from every connected device in the plant (inverters, meters, sensors, trackers), aggregates that data in a central server, and presents it to operators through dashboards, alarms, and reports. Integration means connecting those data streams not just to a display screen, but to the systems your team actually uses to act — your power plant maintenance software, your ticketing workflow, your maintenance schedule.
For a utility-scale solar plant, a SCADA system typically handles data from hundreds or thousands of endpoints simultaneously. At a 50 MW plant, that might mean monitoring 12,500 solar panels across 500 string inverters, 20 central inverters, multiple weather stations, and transformer substations — all in real time. Without SCADA, this volume of equipment is simply unmanageable with manual inspections.
SCADA systems collect data through a layered architecture. Field devices (inverters, sensors, meters) sit at the bottom layer. A data concentrator or Remote Terminal Unit (RTU) aggregates readings from multiple field devices and forwards them to the SCADA server over a communication network — fiber, cellular, or RF. The SCADA server stores, processes, and serves data to the Human-Machine Interface (HMI) where operators monitor the plant in real time.

Three communication protocols dominate solar SCADA deployments. Modbus RTU/TCP is the most widely used — nearly every inverter manufacturer supports it, and it is simple and low-cost to implement. OPC-UA is the modern standard for industrial IoT and SCADA, supporting encrypted data and event-driven subscription models — the OPC Foundation’s UA specification is increasingly required for utility-scale plants. DNP3 is used in North America for utility-grade plants communicating with grid operators or substation automation equipment. Most modern solar SCADA platforms support all three, and protocol converters handle legacy hardware that predates OPC-UA adoption.
A solar SCADA system is only as useful as the data it collects. Plants that monitor only total AC output miss the early fault signals buried in string-level and inverter-level data. Comprehensive SCADA monitoring covers five data categories that together give O&M teams complete plant visibility.
Inverter monitoring tracks AC power output, DC input voltage and current per string, inverter temperature, operating state, and fault codes — inverter failures represent roughly 37% of all corrective maintenance events at utility-scale sites. String monitoring isolates exactly which string is underperforming without deploying a technician to walk the entire row. Environmental sensors — pyranometer, module temperature sensor, wind and soiling monitors — provide the reference data needed to distinguish real underperformance from weather-related dips. Transformer and grid metering catch grid-side issues that would otherwise look like generation problems. Communication and gateway health monitoring ensures the data pipeline itself stays intact.
Predictive maintenance for solar plants means using real-time and historical SCADA data to predict when a component is likely to fail — and scheduling maintenance before that failure happens. The logic works through three connected steps: anomaly detection flags deviations from expected performance baselines; trend analysis identifies whether a degrading pattern is accelerating; and remaining useful life estimation schedules the maintenance window before the threshold is crossed.
A plant running predictive maintenance on SCADA data can realistically target 30% fewer unplanned outages and 20–25% lower O&M costs compared to a purely reactive approach. The key is integrating SCADA data with your IoT meter reading and predictive maintenance module so that anomaly alerts automatically trigger maintenance actions rather than sitting in a dashboard waiting for someone to notice them.
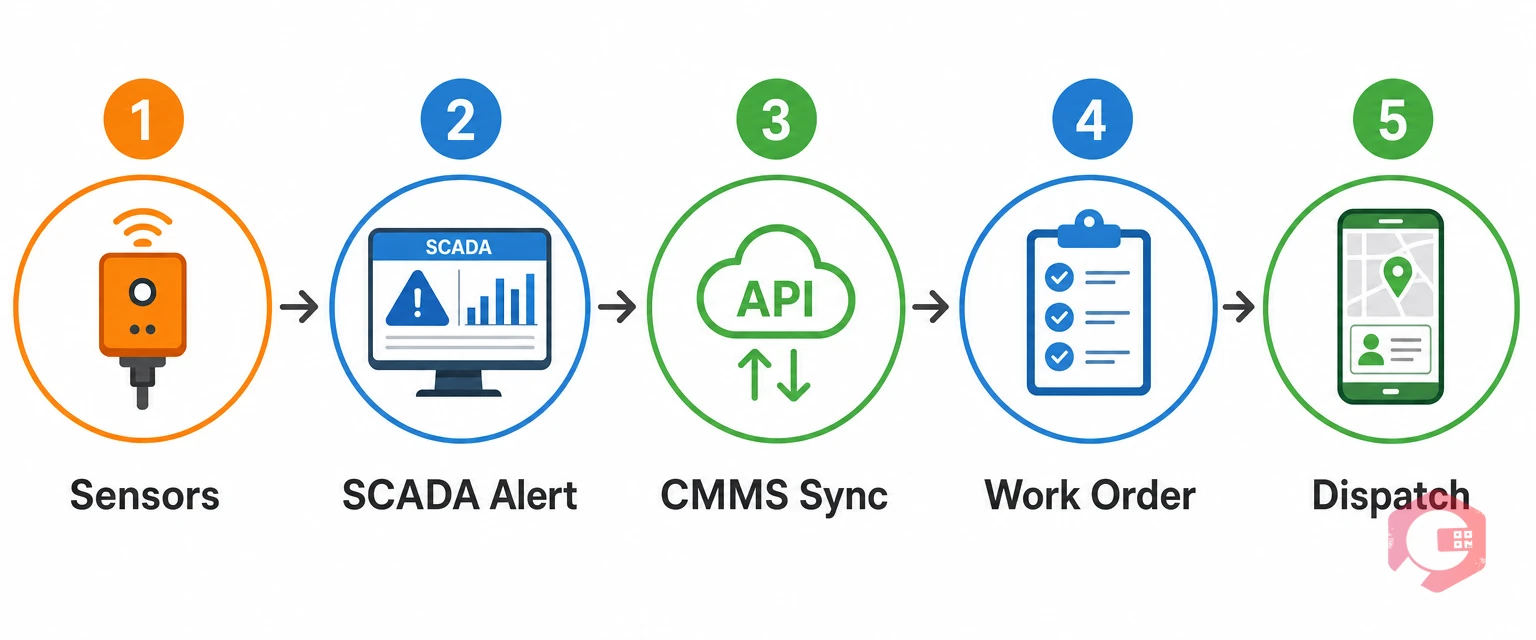
Most solar SCADA guides stop at the monitoring layer. The execution layer — where actual maintenance happens — is your CMMS, and connecting the two is the single highest-leverage improvement most solar O&M teams can make. SCADA tells you what is happening. It does not manage what to do about it. Without a CMMS connection, your O&M team is manually translating SCADA alerts into maintenance actions — introducing delays, losing context, and leaving no auditable trail of who responded to what and when.
A SCADA-CMMS integration works through API connection, middleware/IoT gateway, or scheduled data export. When SCADA detects an anomaly, it automatically triggers a work order in the CMMS with the asset ID, fault description, GPS coordinates, priority level, and relevant historical data pre-populated. The work order routes to the right technician based on availability and location. The technician receives a mobile notification, performs the repair, and logs the fix. That data feeds back into the asset’s maintenance history, closing the loop for the next anomaly cycle. Cryotos CMMS supports SCADA data ingestion through its IoT module, enabling this automated alert-to-work-order flow without manual intervention.
Monitoring without measurement is just watching. These are the five KPIs every solar O&M team should track consistently via SCADA to quantify plant health and maintenance program effectiveness.
Performance Ratio (PR) is the most important single metric — it compares actual energy output to theoretical output based on irradiance received. A well-maintained utility-scale plant should maintain a PR above 75–80%. Specific Yield (kWh/kWp) normalizes energy output by installed capacity for cross-site comparison. MTTR (Mean Time to Repair) — industry benchmark for inverter faults is under 4 hours for on-site teams; track it via your downtime tracking module and review monthly. MTBF (Mean Time Between Failures) — rising MTBF signals your PM program is working; declining MTBF signals aging equipment or a PM coverage gap. Availability — contractual guarantees at utility-scale plants typically specify 97–98%; SCADA provides the minute-by-minute data needed to calculate this accurately for reporting.
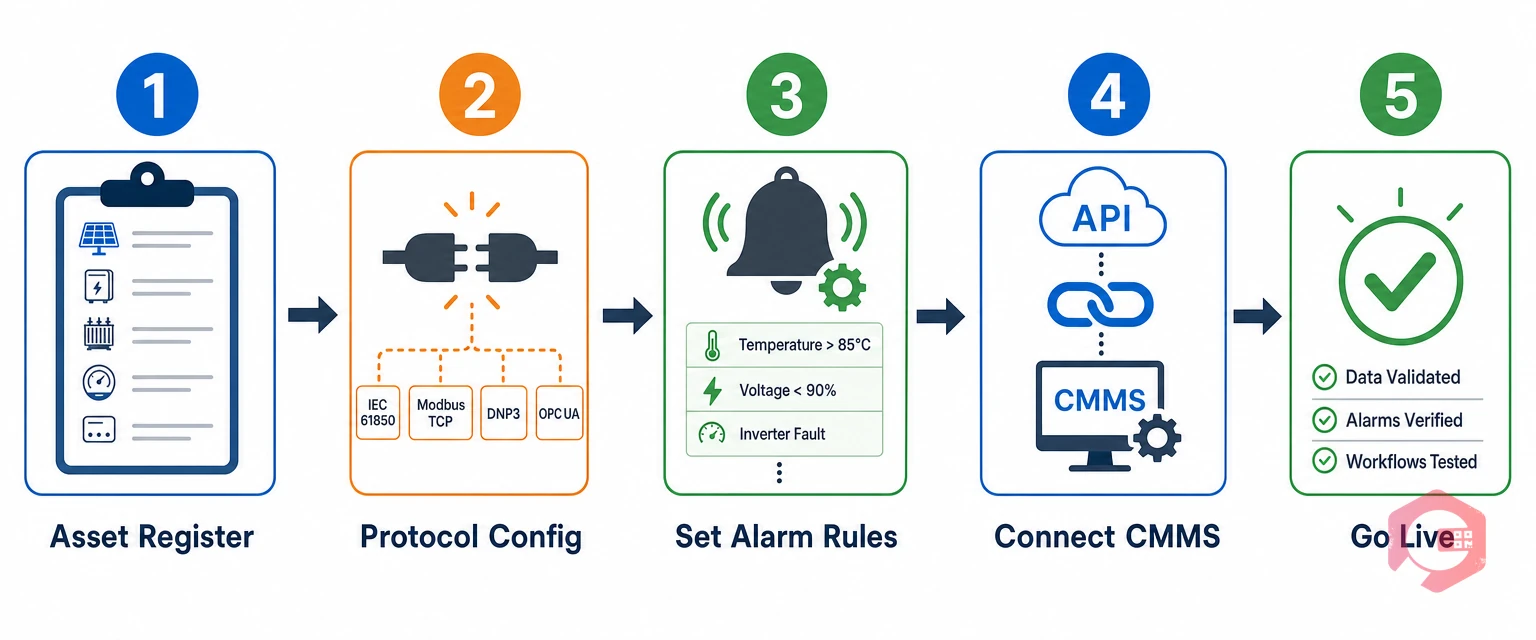
Here is a practical setup framework for teams deploying or integrating solar SCADA with their maintenance workflow. Step 1: create a complete asset register with unique IDs for every inverter, combiner box, weather station, and meter — this is the anchor that links SCADA data points to CMMS asset records. Step 2: map each device to its supported protocol (Modbus, OPC-UA, DNP3) and configure protocol converters for mixed-brand plants. Step 3: define data points and polling intervals — inverter fault codes every 5 seconds, energy yield every 15 minutes, environmental data every 1–5 minutes. Step 4: set alarm rules and thresholds — output deviation >10%, inverter temperature >65°C, communication loss >30 seconds. Step 5: connect SCADA to your CMMS via API or IoT gateway and run end-to-end tests simulating fault conditions to verify work order creation. Step 6: train the O&M team on the closed-loop workflow. Step 7: establish KPI baselines and set a monthly review cadence to catch drift before it affects contractual availability targets.
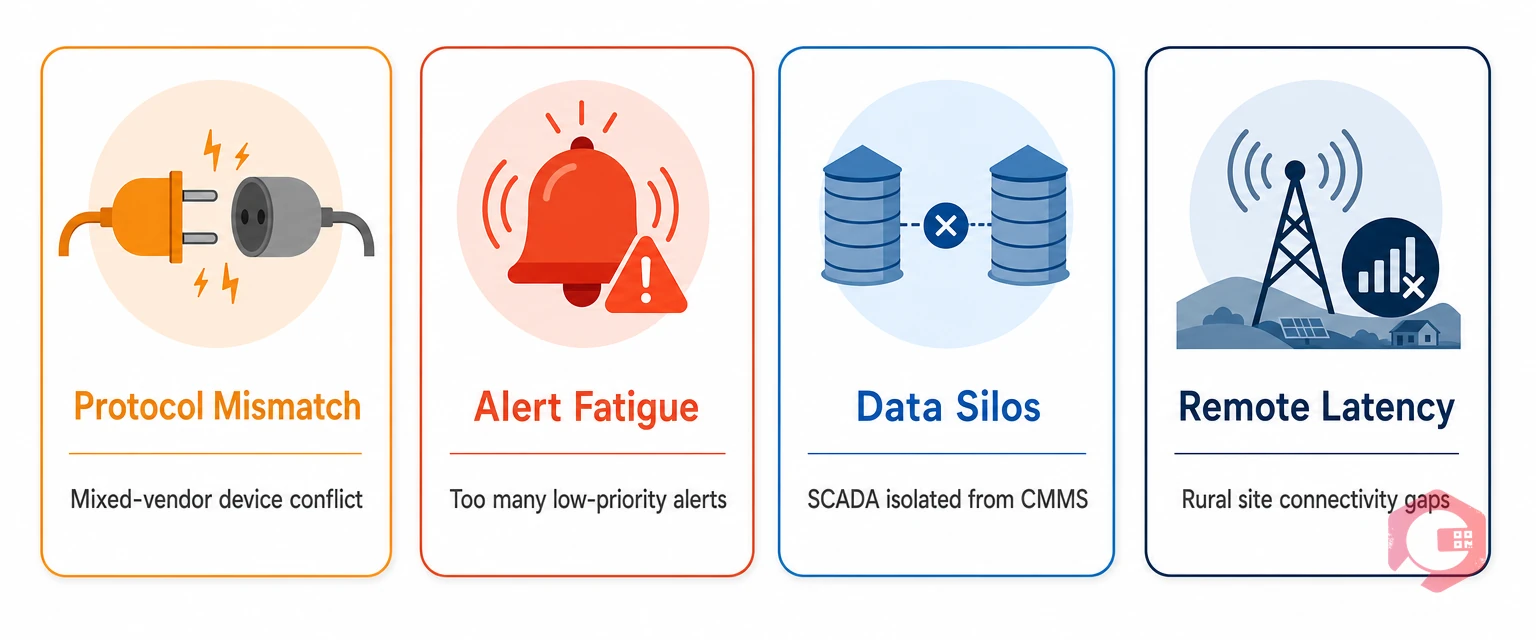
Even well-planned SCADA deployments run into recurring problems. Protocol mismatch: solve with a universal data concentrator (Moxa gateway or Kepware OPC server) that normalizes all device data into a single OPC-UA feed, regardless of what each inverter brand natively supports. Alert fatigue: start with wide thresholds and tighten progressively using 30-day baseline data; classify alerts by severity and only auto-create CMMS work orders for critical and warning levels — informational alerts stay in the SCADA dashboard. Data silos: enforce a single asset ID standard across all systems before integration begins; retrofitting asset ID alignment after go-live is significantly more expensive than defining it upfront. Remote latency: deploy a local data historian at the site that buffers data during connectivity loss and syncs when connection resumes; use a CMMS mobile app with offline sync capability so field technicians can log repairs even without network access.
SCADA collects real-time operational data from every device in a solar plant and centralizes it for monitoring, alarming, and analysis. Its role is to give O&M teams complete visibility into plant performance so they can detect faults early, track KPIs like Performance Ratio and availability, and respond to issues faster than any manual inspection process allows.
The three dominant protocols are Modbus RTU/TCP — most widely supported by inverter manufacturers — OPC-UA, which is the modern standard for secure and interoperable industrial communication, and DNP3, used in utility-grade and grid-connected plants, particularly in North America. Most modern SCADA platforms support all three, and protocol converters handle legacy devices.
SCADA reduces downtime by detecting fault conditions in real time and triggering immediate maintenance responses. When integrated with a CMMS, SCADA alerts automatically create work orders, assign technicians, and track resolution without manual steps. Plants with automated SCADA-to-CMMS workflows typically see 25–30% reductions in unplanned downtime because the time between fault detection and technician dispatch drops from hours to minutes.
Yes — and this integration is one of the most impactful upgrades an O&M team can make. The integration works via API or IoT gateway. When SCADA detects an alarm condition, it sends the asset ID, fault type, and telemetry data to the CMMS, which automatically creates and routes a work order. Cryotos CMMS supports IoT integration natively, allowing SCADA event data to trigger work orders, assign technicians, and update asset history without manual input.
A Performance Ratio above 75–80% is considered good for a utility-scale solar plant under IEA PVPS guidelines. New plants often achieve 80–85% PR in their first year. Tracking PR monthly via SCADA and investigating any drop greater than 3 percentage points is standard O&M practice — small PR drops that persist across multiple months often signal soiling accumulation, shading issues, or early inverter degradation.
Managing a solar plant’s SCADA data is one thing. Turning that data into faster repairs, complete audit trails, and measurable uptime improvements is another. Cryotos CMMS bridges the gap — connecting your SCADA alerts directly to automated work orders, mobile technician dispatch, and real-time downtime tracking. Book a free Cryotos demo to see how solar O&M teams close the loop between monitoring and maintenance.


Cryotos AI predicts failures, automates work orders, and simplifies maintenance—before problems slow you down.


